Reactivity 2.2.5 – Catalysts and Energy Profiles
Catalyst:
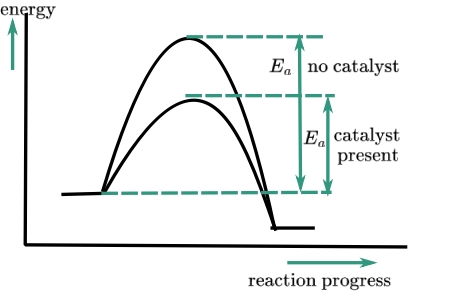
- A catalyst is a substance that increases the rate of a chemical reaction by providing an alternative reaction pathway with a lower activation energy (\( E_a \)). It is not consumed in the reaction and remains chemically unchanged at the end.
- This increases the number of particles with energy greater than or equal to \( E_a \), leading to more successful collisions per unit time.
Key Characteristics:
- Increases the rate of reaction without being used up.
- Lowers the activation energy, allowing more particles to collide with sufficient energy to react.
- Does not alter the enthalpy change (\( \Delta H \)) of the reaction.
- Can be reused multiple times.
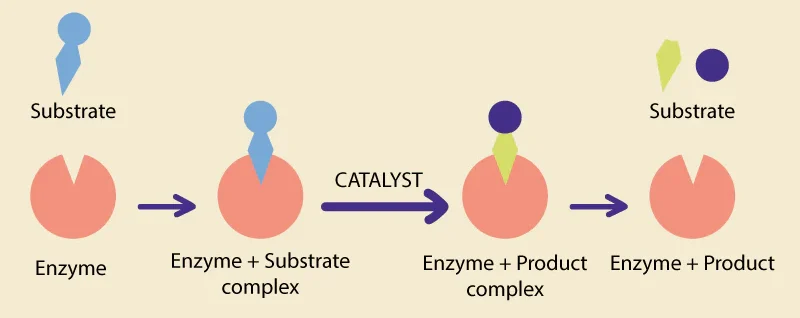
- May be specific to certain reactions (especially enzymes).

Environmental Impact of Catalysts:
- Reduced energy consumption: By lowering activation energy, reactions can proceed at lower temperatures and pressures, saving energy.
- Reduced emissions: Faster, more complete reactions mean fewer pollutants and by-products.
- Improved atom economy: Catalysts can promote reactions with higher atom economy, leading to less waste.
- Reusability: Catalysts are not consumed, reducing the need for continuous raw material input.
Example in Industry:
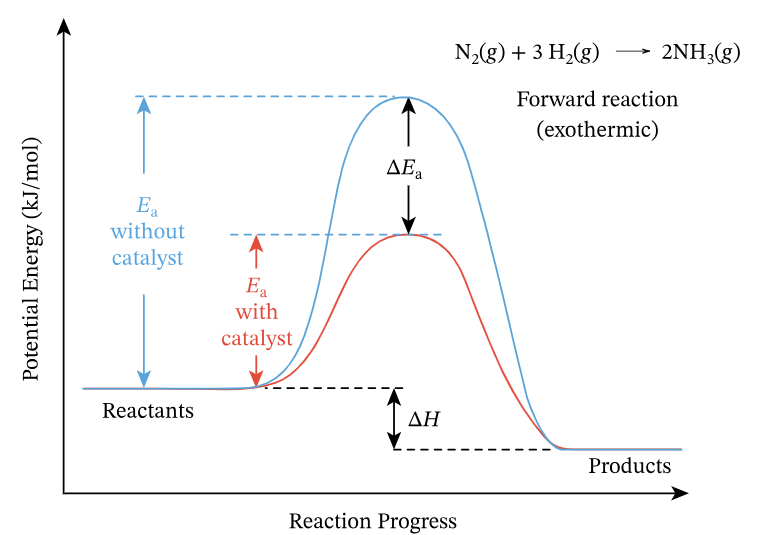
- Iron catalyst in the Haber process reduces the temperature and pressure needed to produce ammonia, saving energy and lowering CO2 emissions.
- Platinum-based catalysts in catalytic converters convert harmful gases (CO, NO, hydrocarbons) into less harmful ones (CO2, N2, H2O).
Types of Catalysts
| Type | Description | Example |
|---|---|---|
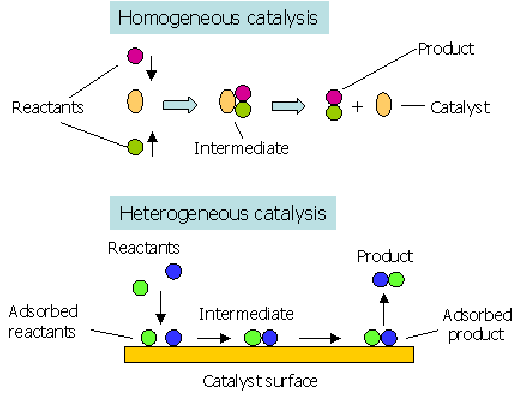
Homogeneous Catalyst | Catalyst is in the same phase (state) as reactants | Sulfuric acid in esterification reactions |
Heterogeneous Catalyst | Catalyst is in a different phase from the reactants | Iron in the Haber process; Pt in catalytic converters |
Enzymes (Biological Catalysts) | Highly specific protein-based catalysts in living organisms | Amylase catalyses the breakdown of starch to glucose |
Energy Profile Diagrams
1. Exothermic Reactions
In an exothermic reaction, the products have lower energy than the reactants. Energy is released into the surroundings, and \( \Delta H \) is negative.
- Activation energy \( E_a \) = energy required to start the reaction (with no catalyst)
- With a catalyst: a new pathway forms with lower \( E_a \)
Energy profile diagram should include:
- Y-axis: Energy
- X-axis: Reaction progress (reaction coordinate)
- Curve showing a peak for activation energy
- Lower peak (dashed or separate line) for catalysed reaction
- Reactants at higher energy than products
- Labelled activation energy and \( \Delta H \)
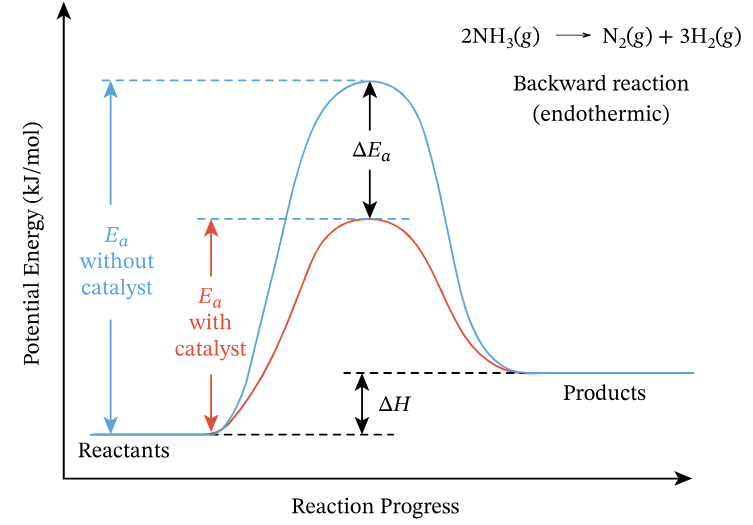
2. Endothermic Reactions
In an endothermic reaction, the products have higher energy than the reactants. Energy is absorbed from the surroundings, and \( \Delta H \) is positive.
- Reactants gain energy to reach the transition state
- The catalyst still lowers \( E_a \), but \( \Delta H \) remains unchanged
Energy profile diagram should include:
- Reactants at lower energy than products
- High activation energy peak (uncatalysed)
- Lower peak for catalysed pathway
- Label both \( E_a \) values and \( \Delta H \)
Summary Table – Energy Profiles with and without Catalysts
| Feature | Without Catalyst | With Catalyst |
|---|---|---|
| Activation Energy (\( E_a \)) | Higher | Lower (alternative pathway) |
| Reaction Rate | Slower | Faster |
| Position of Reactants and Products | Unchanged | Unchanged |
| Enthalpy Change (\( \Delta H \)) | Same | Same |
Maxwell–Boltzmann Distribution and Activation Energy
Maxwell–Boltzmann Distribution Curve:
This curve shows the distribution of kinetic energies among gas particles at a given temperature.
- The x-axis represents kinetic energy.
- The y-axis represents the number of particles with that energy.
- Most particles have moderate kinetic energy, some have very low or very high energy.
Key Features of the Curve:
- Starts at origin (0,0) – no particles have zero energy.
- Peak represents the most probable energy (not average).
- The curve never touches the x-axis – there’s always a small number of very high-energy particles.
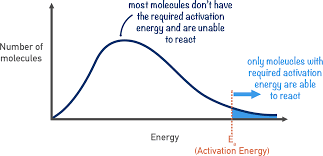
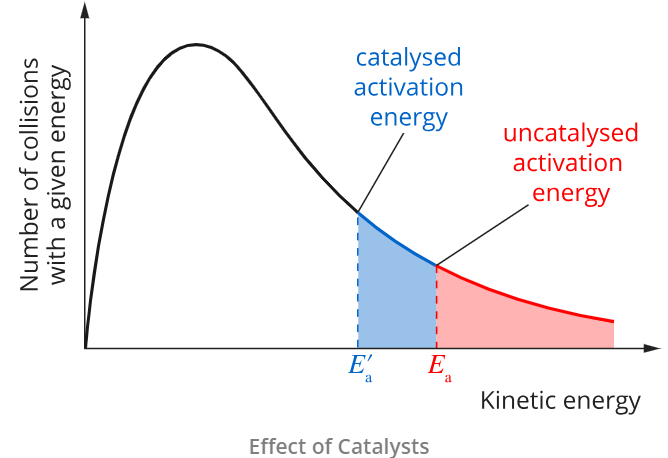
Effect of Activation Energy on Reaction Rate
Activation Energy (\( E_a \)) is the minimum energy that reacting particles must have for a successful collision leading to a reaction.
In a Maxwell–Boltzmann curve, \( E_a \) is shown as a vertical line on the energy axis. The area under the curve to the right of \( E_a \) represents the fraction of particles that have enough energy to react successfully.
1. Higher Activation Energy (Uncatalyzed Reaction)
- Fewer particles have sufficient energy \( \geq E_a \).
- Low frequency of successful collisions → slow reaction rate.
2. Lower Activation Energy (Catalyzed Reaction)
- The \( E_a \) line shifts left.
- Larger area under the curve exceeds \( E_a \).
- More particles can successfully collide → faster reaction.
Example:
Decomposition of hydrogen peroxide with and without catalyst:
\( 2\text{H}_2\text{O}_2(aq) \rightarrow 2\text{H}_2\text{O}(l) + \text{O}_2(g) \)
▶️Answer/Explanation
Without a catalyst, the activation energy is high. Only a small number of particles have enough energy to react. When manganese(IV) oxide is added as a catalyst, \( E_a \) is lowered, increasing the fraction of molecules with sufficient energy, leading to a faster decomposition rate.
Summary – Effect of Activation Energy on Maxwell–Boltzmann Curve
| Scenario | Activation Energy | Particles with \( E \geq E_a \) | Reaction Rate |
|---|---|---|---|
| No catalyst | Higher | Lower fraction | Slow |
| With catalyst | Lower | Greater fraction | Fast |
Example:
Ethene reacts with hydrogen in the presence of a nickel catalyst to form ethane. This reaction is used in the food industry to convert unsaturated fats into saturated fats (e.g. in margarine production):
\( \text{C}_2\text{H}_4(g) + \text{H}_2(g) \xrightarrow{\text{Ni}} \text{C}_2\text{H}_6(g) \)
Explain how the use of a nickel catalyst affects the activation energy and reaction rate. Also describe how this would appear on a Maxwell–Boltzmann distribution curve.
▶️Answer/Explanation
The nickel catalyst provides an alternative reaction pathway with a lower activation energy (\( E_a \)). As a result, a greater proportion of reacting molecules will have sufficient kinetic energy to successfully collide and form products.
On a Maxwell–Boltzmann distribution curve, the vertical line representing \( E_a \) shifts to the left. The area under the curve beyond this new \( E_a \) increases, indicating a higher probability of successful collisions and therefore a faster reaction rate.
This is an example of a heterogeneous catalyst because Ni is a solid while the reactants are gases.
Example:
Hydrogen peroxide decomposes slowly in aqueous solution. The addition of manganese(IV) oxide significantly increases the rate of decomposition:
\( 2\text{H}_2\text{O}_2(aq) \xrightarrow{\text{MnO}_2} 2\text{H}_2\text{O}(l) + \text{O}_2(g) \)
Describe how the addition of a catalyst changes the distribution of kinetic energies required for a successful reaction, and relate this to the concept of activation energy and effective collisions.
▶️Answer/Explanation
Manganese(IV) oxide lowers the activation energy by offering an alternative mechanism for the decomposition reaction. This does not change the shape of the Maxwell–Boltzmann curve but shifts the required \( E_a \) to a lower value.
With a lower \( E_a \), more particles (those in the tail of the distribution curve) now have enough energy to react upon collision. This increases the frequency of successful collisions and accelerates the rate of oxygen gas release.
The catalyst remains unchanged at the end of the reaction and can be reused.