▶️ Answer/Explanation
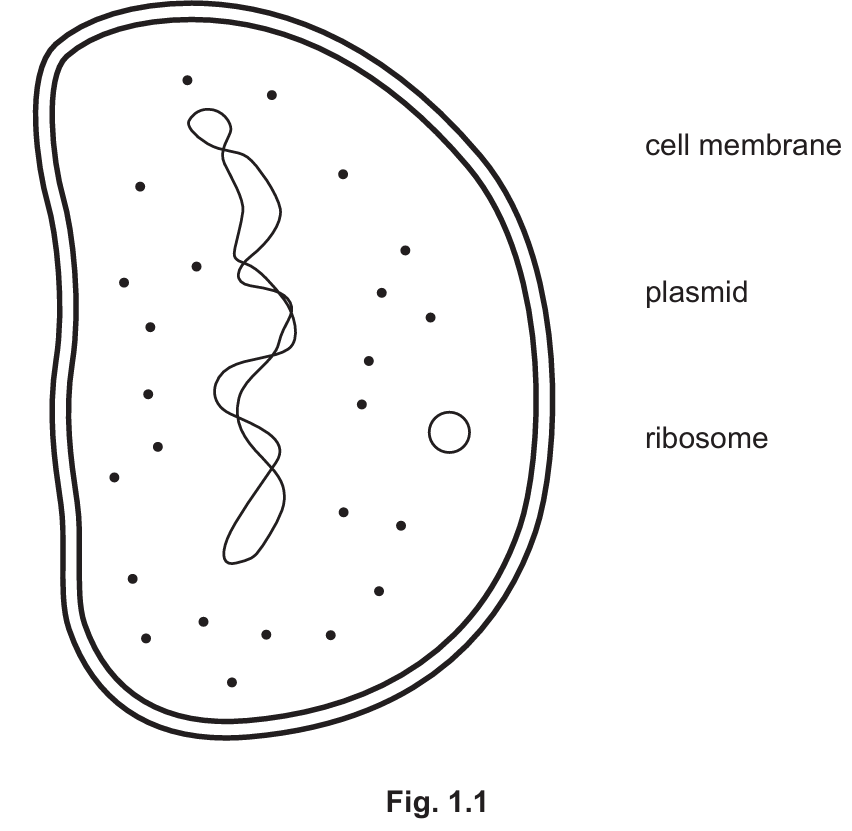
(a)(i) Identification of Structures:
• Cell Membrane: The inner boundary line of the cell (inside the cell wall).
• Plasmid: The small, circular ring of DNA separate from the main genetic material.
• Ribosome: Any of the small dots scattered throughout the cytoplasm.
(a)(ii) Characteristics of Living Organisms:
Any two from: Movement, Respiration, Sensitivity, Growth, Reproduction, Excretion, or Nutrition (often remembered by the acronym MRS GREN).
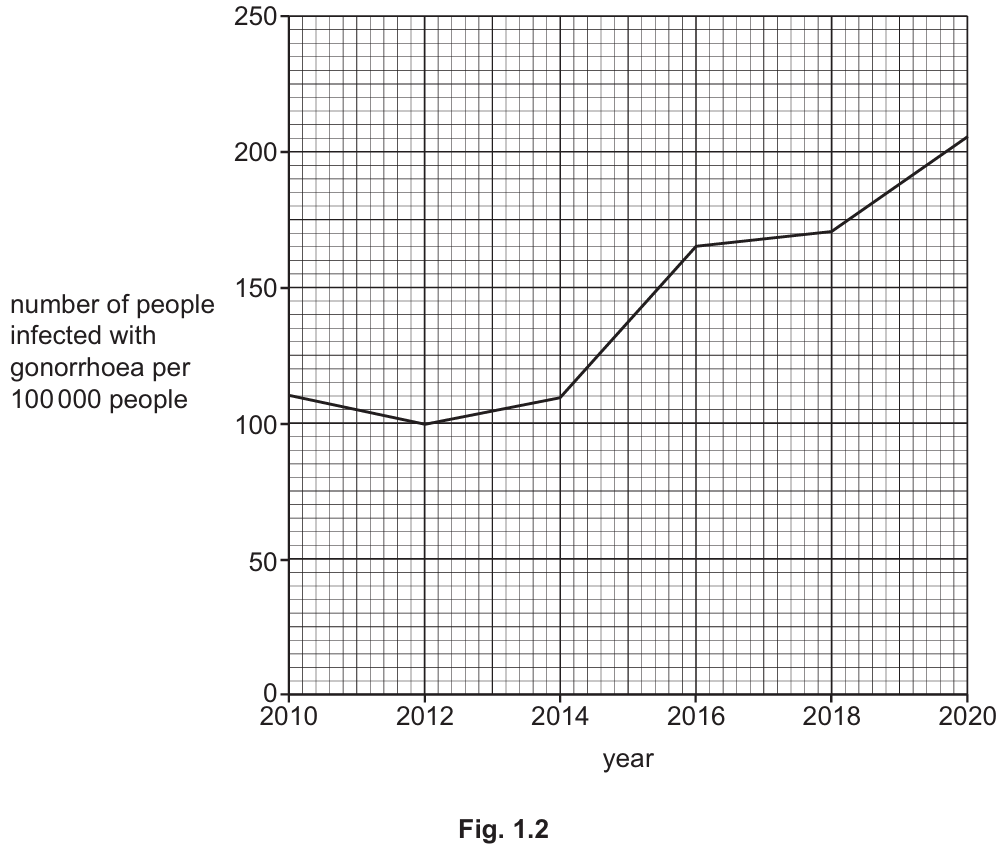
(b)(i) Data Description:
• Overall, the number of people infected increased.
• The two-year period with the largest change is from $2014$ to $2016$ (represented by the steepest part of the slope).
• In $2020$, the number of people infected was $205$ per $100,000$ people.
(b)(ii) Calculation:
From the graph, the rate in $2012$ was $100$ per $100,000$ people.
$$\text{Total infections} = \left( \frac{100}{100,000} \right) \times 800,000 = 800 \text{ people}$$
(c) Antibiotic Effectiveness:
The bacteria have developed antibiotic resistance. This often occurs due to random mutations that allow certain bacteria to survive the treatment and pass on their resistant genes to offspring.
(d) Methods of Control:
• Use of barrier contraception (e.g., condoms or femidoms) to prevent fluid exchange.
• Increased testing and screening to identify and treat asymptomatic carriers.
• Contact tracing to ensure partners of infected individuals are also treated.
• Education regarding safe sex practices and the risks of STIs.
Bacteria are prokaryotic organisms, meaning they lack a nucleus. Instead, their genetic material consists of a main circular chromosome and smaller rings called plasmids, which often carry genes for antibiotic resistance. When we look at population data like Fig. 1.2, we measure the incidence of a disease. The calculation in (b)(ii) uses a ratio; since the rate is “per $100,000$,” and the population is $8$ times that amount ($800,000$), we simply multiply the rate by $8$. Regarding antibiotics, it’s important to understand that individuals don’t become resistant—the bacteria do. This is a classic example of natural selection where the antibiotic acts as a selection pressure.