▶️ Answer/Explanation
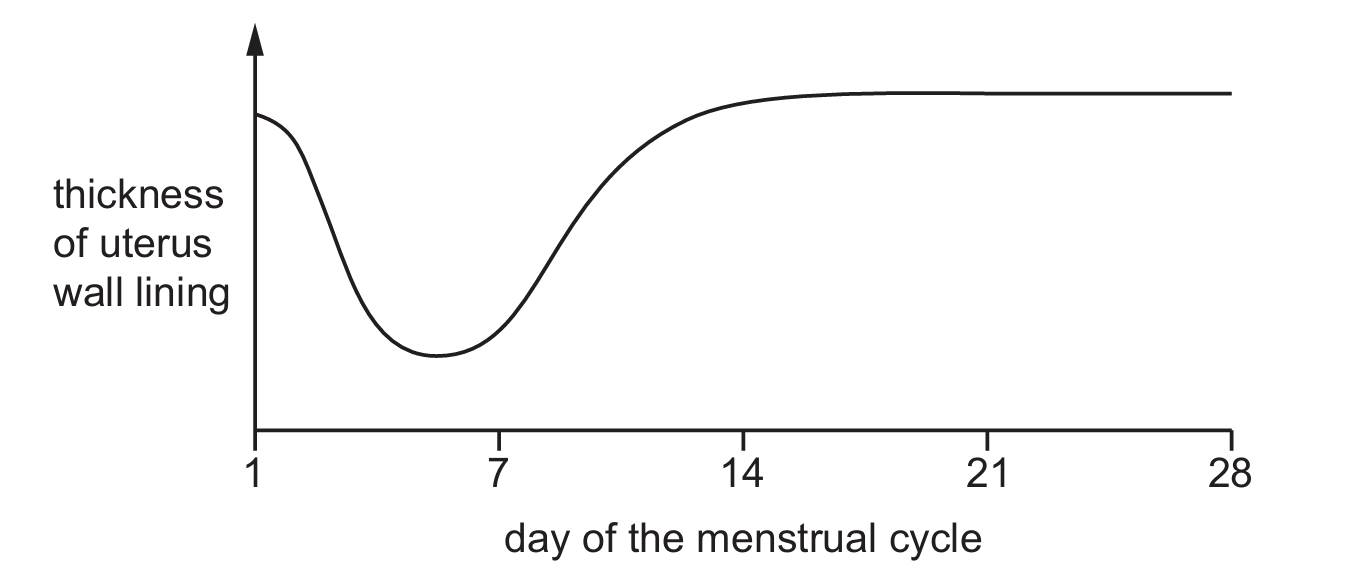
Menstruation is the phase of the menstrual cycle where the uterine lining (endometrium) breaks down and is shed, resulting in a decrease in thickness. Looking at the graph, the thickness starts to decrease from Day $1$ and reaches its lowest point around Day $4$ to Day $5$. After this point, the lining begins to repair and thicken again under the influence of estrogen. Since the decline stops and the “trough” of the graph ends around Day $4$, this represents the conclusion of the shedding phase. Therefore, Day $4$ is the most accurate choice for the last day of menstruation.
✅ Answer: (A)
✅ Answer: (A)