▶️ Answer/Explanation
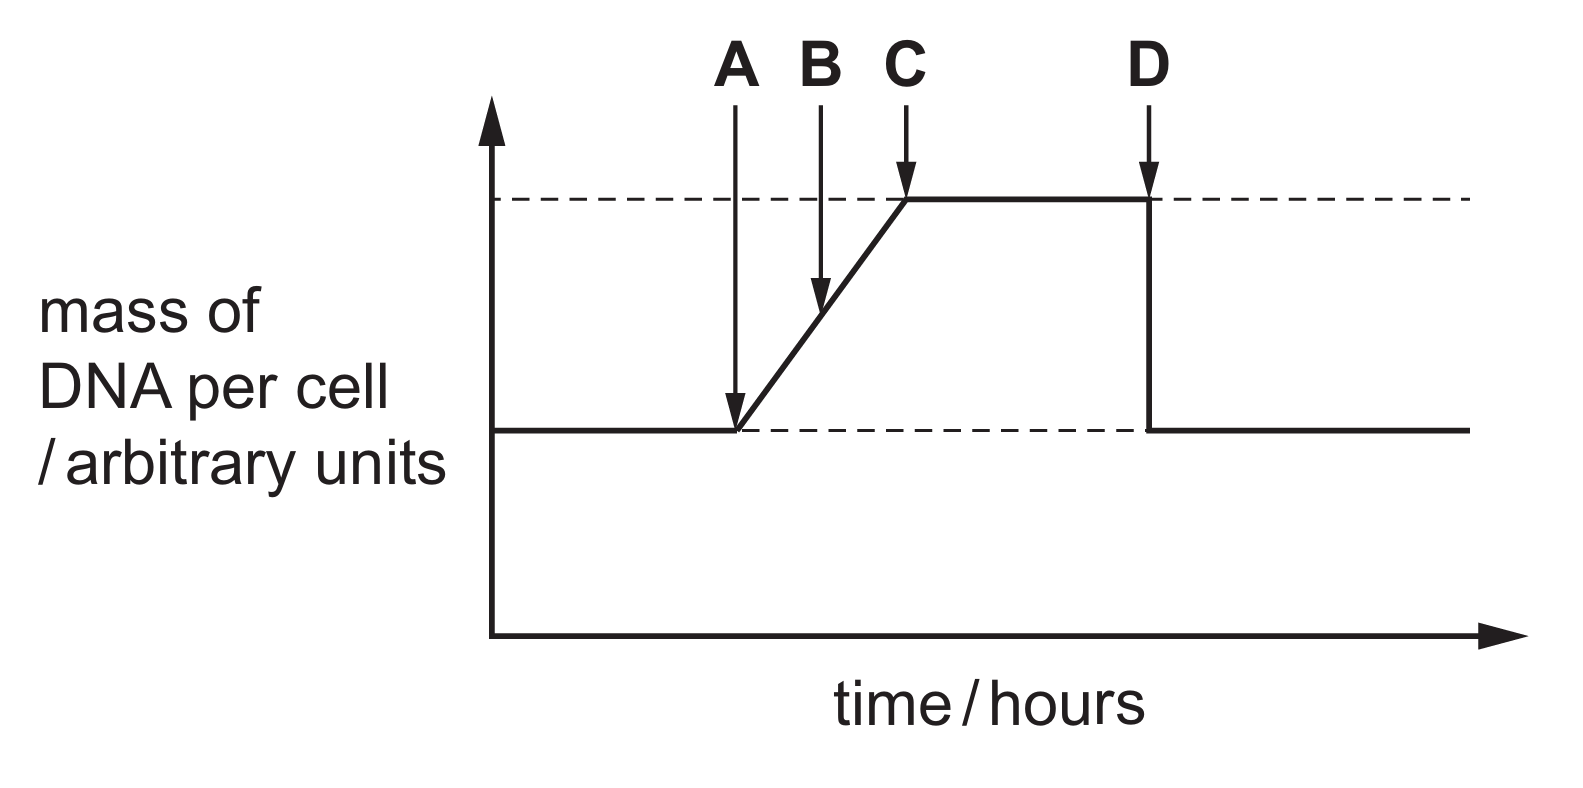
During the cell cycle, DNA replication occurs during the S phase of interphase, which is represented by the slope between points $A$ and $C$. At point $C$, the cell has double the original amount of DNA ($2 \times$ mass). This doubled mass remains constant through the $G_{2}$ phase and the early stages of mitosis (prophase, metaphase, and anaphase).
The sudden drop in DNA mass per cell at point D represents cytokinesis, the physical division of the cytoplasm. At this moment, the single parent cell splits into two identical daughter cells. Consequently, the mass of DNA measured per cell returns to the original baseline level because the total genetic material has been partitioned into two separate nuclei.
✅ Answer: (D)
▶️ Answer/Explanation
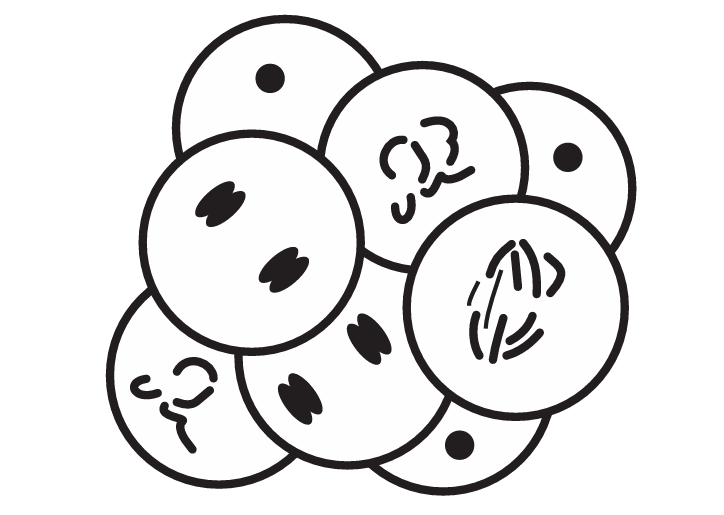
The diagram illustrates an embryo in the early stages of cleavage following fertilisation. These early embryonic cells are stem cells because they are undifferentiated and have the potential to develop into various cell types. The process shown is mitosis, as the embryo must grow and increase its cell number while maintaining the diploid ($2n$) chromosome count. Meiosis is incorrect here because it only occurs during the formation of gametes, not during embryonic growth. Since the image shows a cluster of multiple cells, it is no longer a single-celled zygote, making option C the most accurate description.
✅ Answer: (C)
✅ Answer: (C)
▶️ Answer/Explanation
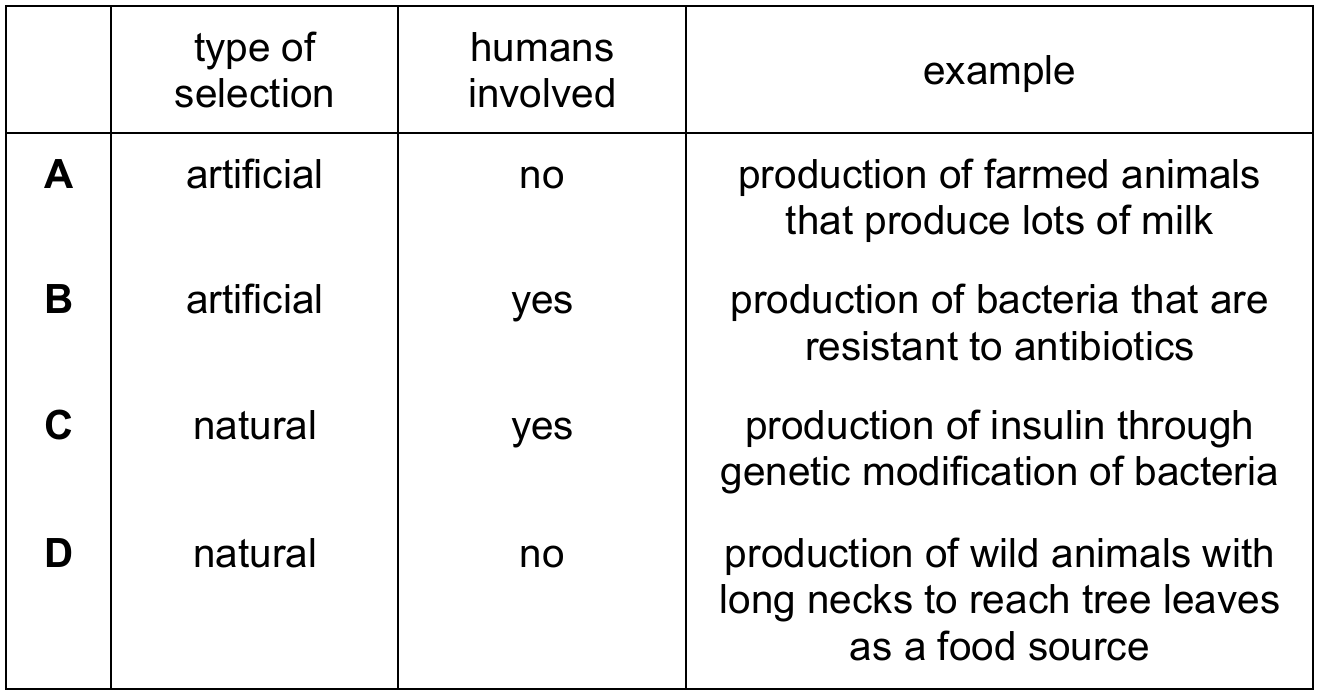
Natural selection occurs when environmental pressures, rather than human intervention, determine which individuals survive and reproduce. In row D, wild animals developing long necks to reach food is a classic example of adaptation driven by survival needs in the wild. While humans might trigger antibiotic resistance (row B) or farm animals (row A), those are types of artificial selection or unintended human-driven evolution. Genetic modification (row C) is a laboratory technique, not natural selection. Therefore, row D is the only entry where the selection type, the absence of human intent, and the biological example align perfectly.
✅ Answer: (D)
✅ Answer: (D)