▶️ Answer/Explanation
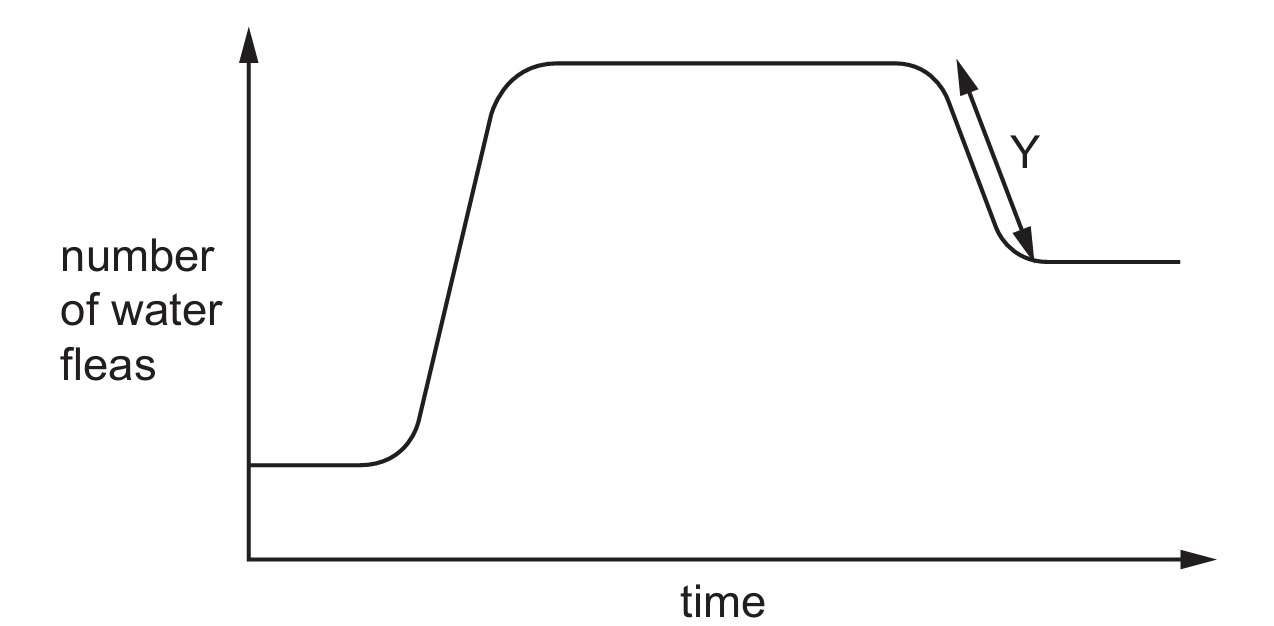
The graph represents a population growth curve. At point $Y$, there is a noticeable decrease in the number of water fleas before the population stabilizes at a lower level. Options (A), (B), and (C) are all factors that would typically cause a population to increase or remain high by improving survival conditions or reproductive output. However, the introduction of a predator, as suggested in option (D), increases the death rate and reduces the overall population size. This shift leads to a new, lower carrying capacity for the water fleas within the pond ecosystem.
✅ Answer: (D)
✅ Answer: (D)