
▶️ Answer/Explanation
(a)(i)
Answer: Elephas
Explanation: In the binomial system of nomenclature (Scientific naming), the name is composed of two parts: the Genus followed by the species. The scientific name given is Elephas maximus. Therefore, Elephas is the genus. Note that genus names must always start with a capital letter.
(a)(ii)
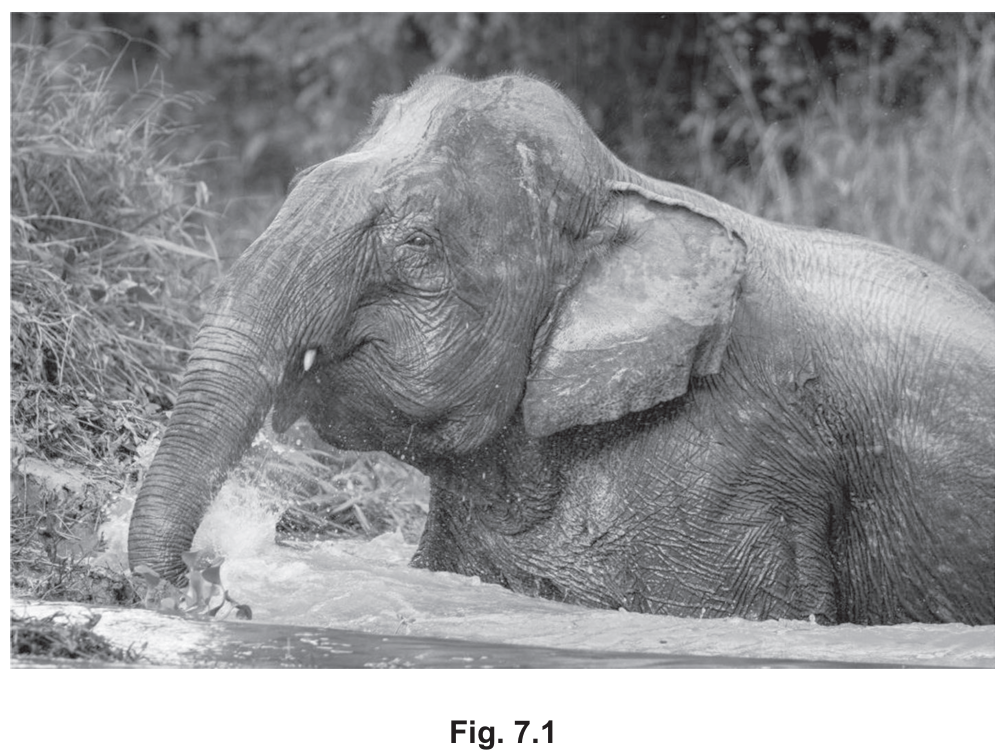
Answer: Hair / external ear / pinna
Explanation: Mammals are distinguished by specific visible features. In the photograph (Fig. 7.1), the presence of hair (even if sparse on an elephant) and the pinna (the external ear flap) are diagnostic features of the class Mammalia.
(b)(i)
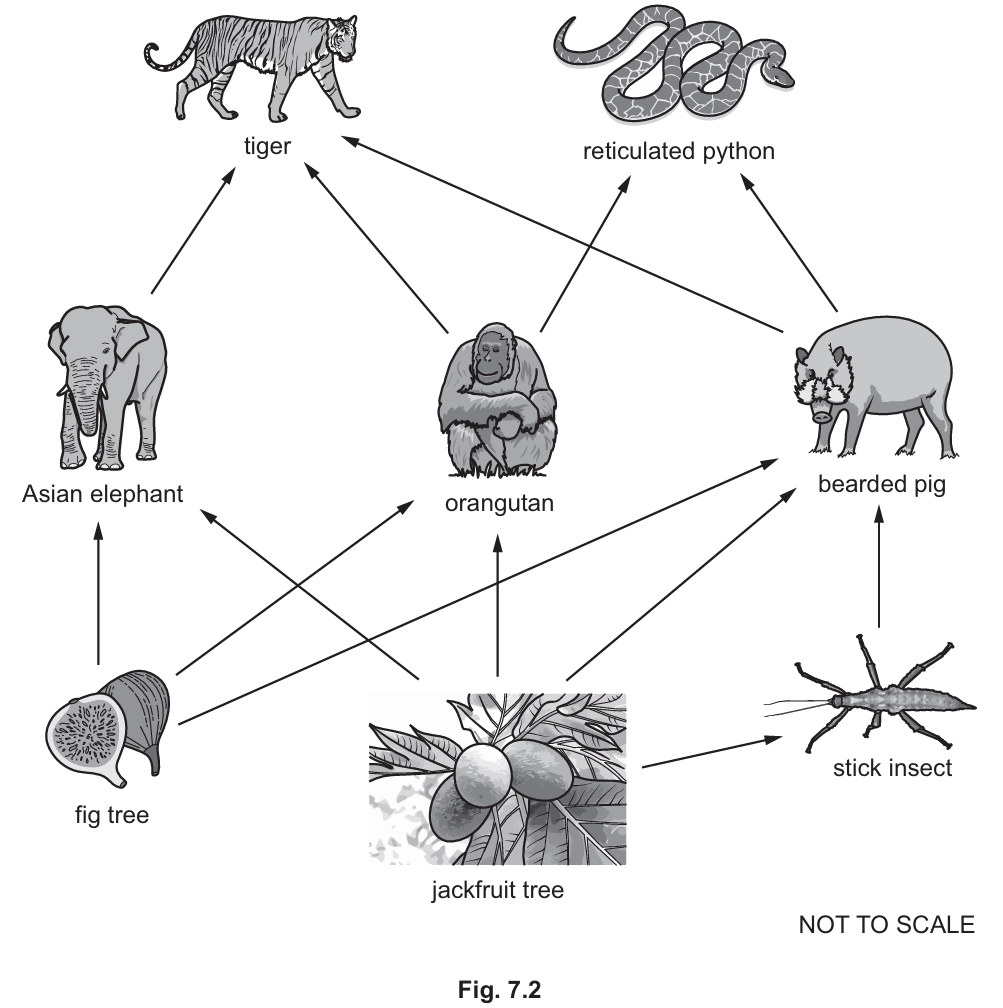
Answer: (Bearded) pig
Explanation: An organism that eats both plants and animals is an omnivore. In the food web, arrows point from the food source to the consumer. The bearded pig has arrows pointing to it from the jackfruit tree (plant) and the stick insect (animal), making it both a herbivore and a carnivore (omnivore).
(b)(ii)
Answer: (Reticulated) python OR Tiger
Explanation: A tertiary consumer feeds on secondary consumers (who feed on primary consumers).
Path example 1: Jackfruit tree $\rightarrow$ Stick insect $\rightarrow$ Bearded pig $\rightarrow$ Tiger.
Path example 2: Jackfruit tree $\rightarrow$ Stick insect $\rightarrow$ Bearded pig $\rightarrow$ Python.
In these chains, the tiger and python act as tertiary consumers (4th trophic level).
(b)(iii)
Answer: Fig (tree) OR jackfruit (tree)
Explanation: Producers are organisms that make their own nutrients, usually using sunlight (plants). In a food web diagram, producers are at the base and have no arrows pointing towards them (no predation upon them is shown, or rather, they do not consume others). Both trees listed are producers.
(b)(iv)
Answer: Stick insect
Explanation: Arthropods are invertebrates with an exoskeleton, segmented bodies, and jointed legs. The stick insect fits this description.
(b)(v)
Answer: Fig (tree) / Jackfruit (tree) $\longrightarrow$ Orangutan $\longrightarrow$ Tiger / (Reticulated) python
Explanation: The question requires a chain including the orangutan.
1. The orangutan eats fruit (arrow from Fig or Jackfruit tree).
2. The orangutan is eaten by predators (arrow to Tiger or Python).
Therefore, the sequence is: Producer $\rightarrow$ Primary Consumer (Orangutan) $\rightarrow$ Secondary Consumer.
(b)(vi)
Answer: A unit containing the community of organisms and their environment interacting together.
Explanation: An ecosystem is defined by the interaction between the biotic factors (the community of living organisms) and the abiotic factors (the physical environment) in a specific area.
(c)
Answer:
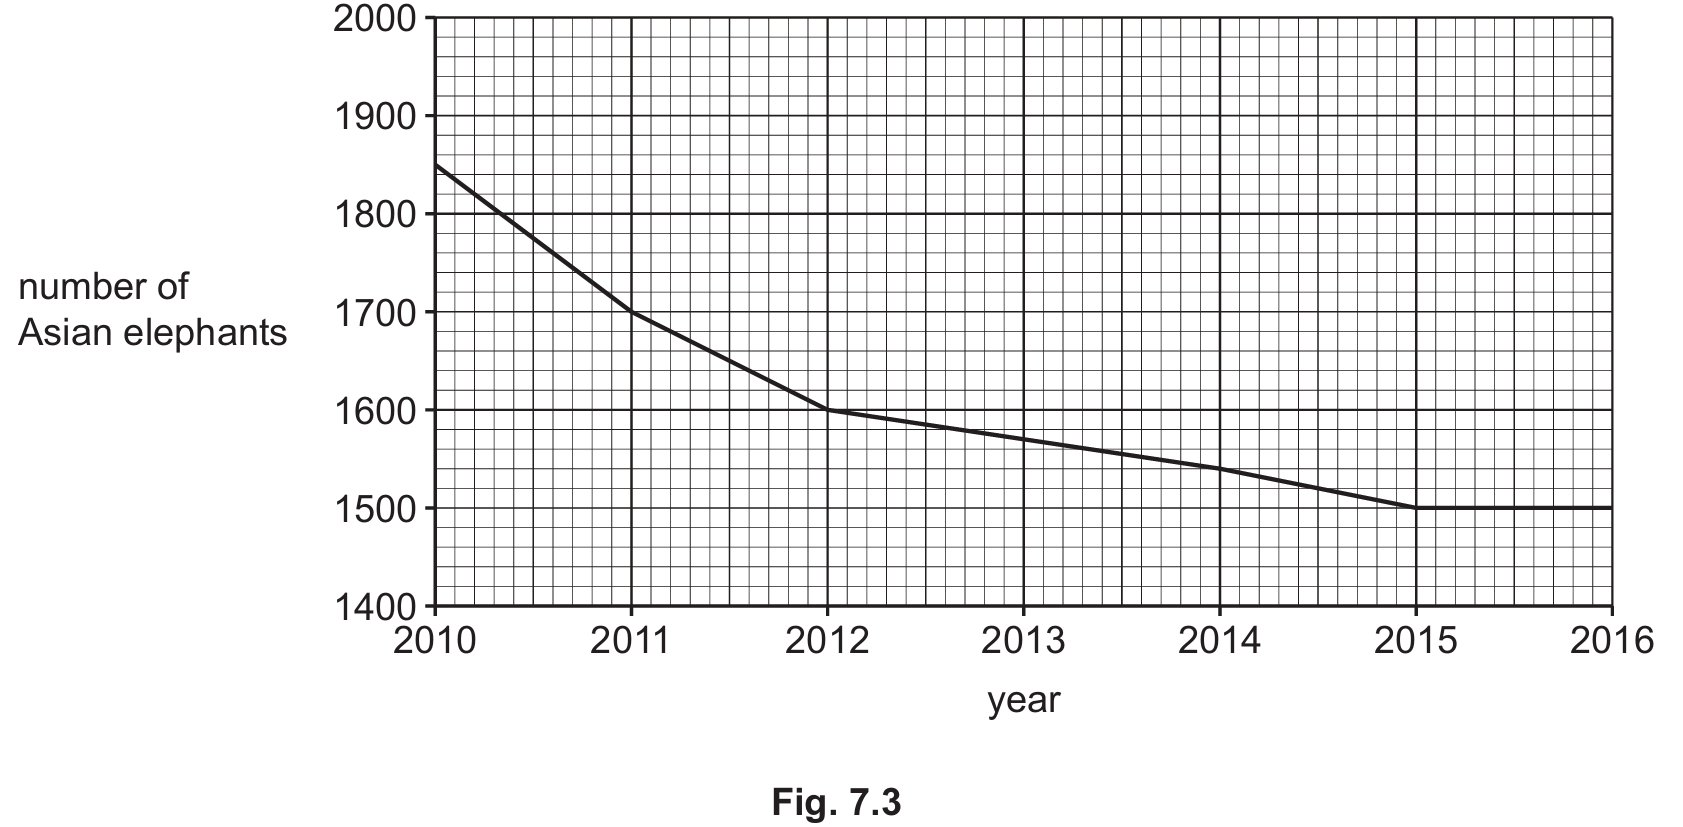
• The population decreases.
• The decrease is from $1850$ to $1500$ (a drop of $350$).
• The population becomes stable / stays the same from $2015$ to $2016$.
• The decrease is most rapid in the first two years ($2010–2012$).
Explanation: When describing a graph, you must state the general trend (decrease) and support it with specific data points extracted from the axes. The graph starts at $1850$ in $2010$ and drops to $1500$ by $2015$, after which the line becomes horizontal (plateaus).
(d)
Answer: (Any three from the following):
• Habitat loss / deforestation / fragmentation
• Loss of food source
• Hunting / poaching / predation / overharvesting
• Climate change / global warming
• Pollution
• Disease
• Introduced species
Explanation: These are the standard biological factors that drive species toward extinction. For elephants specifically, habitat destruction (for farming) and poaching (for ivory) are major drivers, but the mark scheme accepts general valid reasons for organisms becoming endangered.