▶️ Answer/Explanation
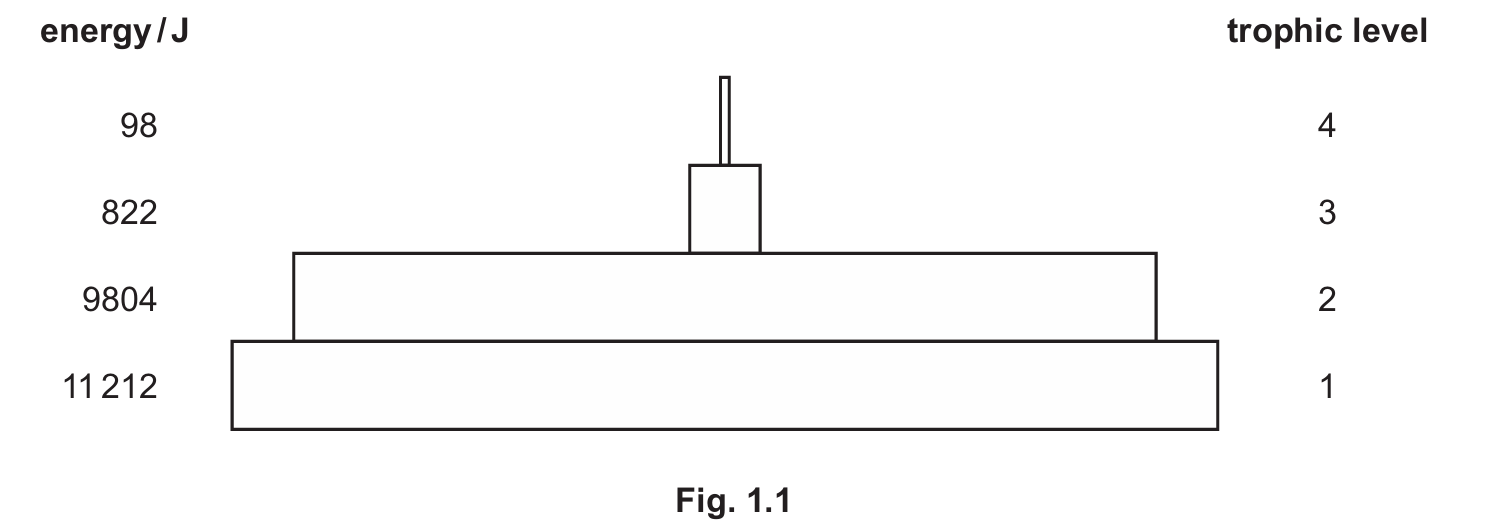
(a)(i) Sun
Trophic level \(1\) consists of producers (usually plants or algae). They produce their own organic nutrients via photosynthesis, which utilizes light energy directly from the Sun.
(a)(ii) \(8\) %
To calculate the percentage efficiency of energy transfer between trophic level \(2\) and trophic level \(3\), use the following formula: \[ \frac{\text{Energy at Trophic Level 3}}{\text{Energy at Trophic Level 2}} \times 100 \] Substituting the values from Fig. 1.1: \[ \frac{822}{9804} \times 100 = 8.3843… \% \] The question asks for one significant figure, so \(8.38…\) rounds down to \(8\).
(a)(iii) Energy loss reasons (Any two):
Energy transfer between trophic levels is inefficient (typically only about \(10\%\) is passed on). The loss occurs because:
- Energy is lost as heat during respiration.
- Energy is used for metabolic processes and movement (muscle contraction).
- Not all of the organism in the previous level is eaten (e.g., roots, bones, fur).
- Not all of the consumed material is digested; some is lost in faeces (egestion) or urine (excretion).
(a)(iv) Advantages of Pyramid of Energy:
Compared to a pyramid of biomass, a pyramid of energy provides a more accurate representation of the ecosystem over time because:
- It represents the rate of production rather than a snapshot in time.
- It accounts for organisms that reproduce very rapidly (like phytoplankton) which might have a low biomass at any single moment but high energy productivity (preventing inverted pyramids).
- It allows for meaningful comparisons between different ecosystems.
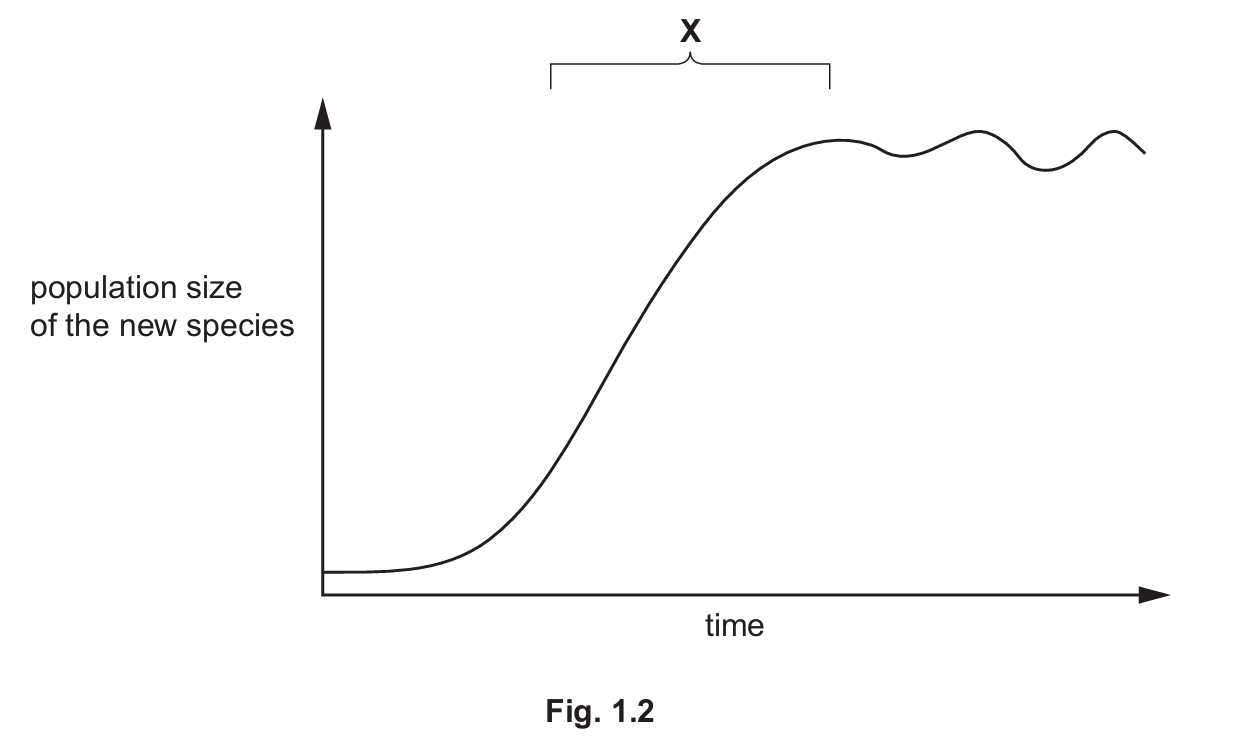
(b)(i) Area; Time
The biological definition of a population is “a group of organisms of one species living in the same area at the same time.”
(b)(ii) Explanation of Region X (Stationary Phase):
Region X represents the stationary phase of the population growth curve.
- Description: The population size has plateaued; growth has slowed and the population size is fluctuating around a carrying capacity.
- Explanation: At this stage, the birth rate is approximately equal to the death rate. This equilibrium occurs because resources (such as food, space, or water) have become limiting factors. Additionally, competition for these resources has increased, and predation or disease may have risen, preventing further exponential growth.