▶️ Answer/Explanation
(a)(i)
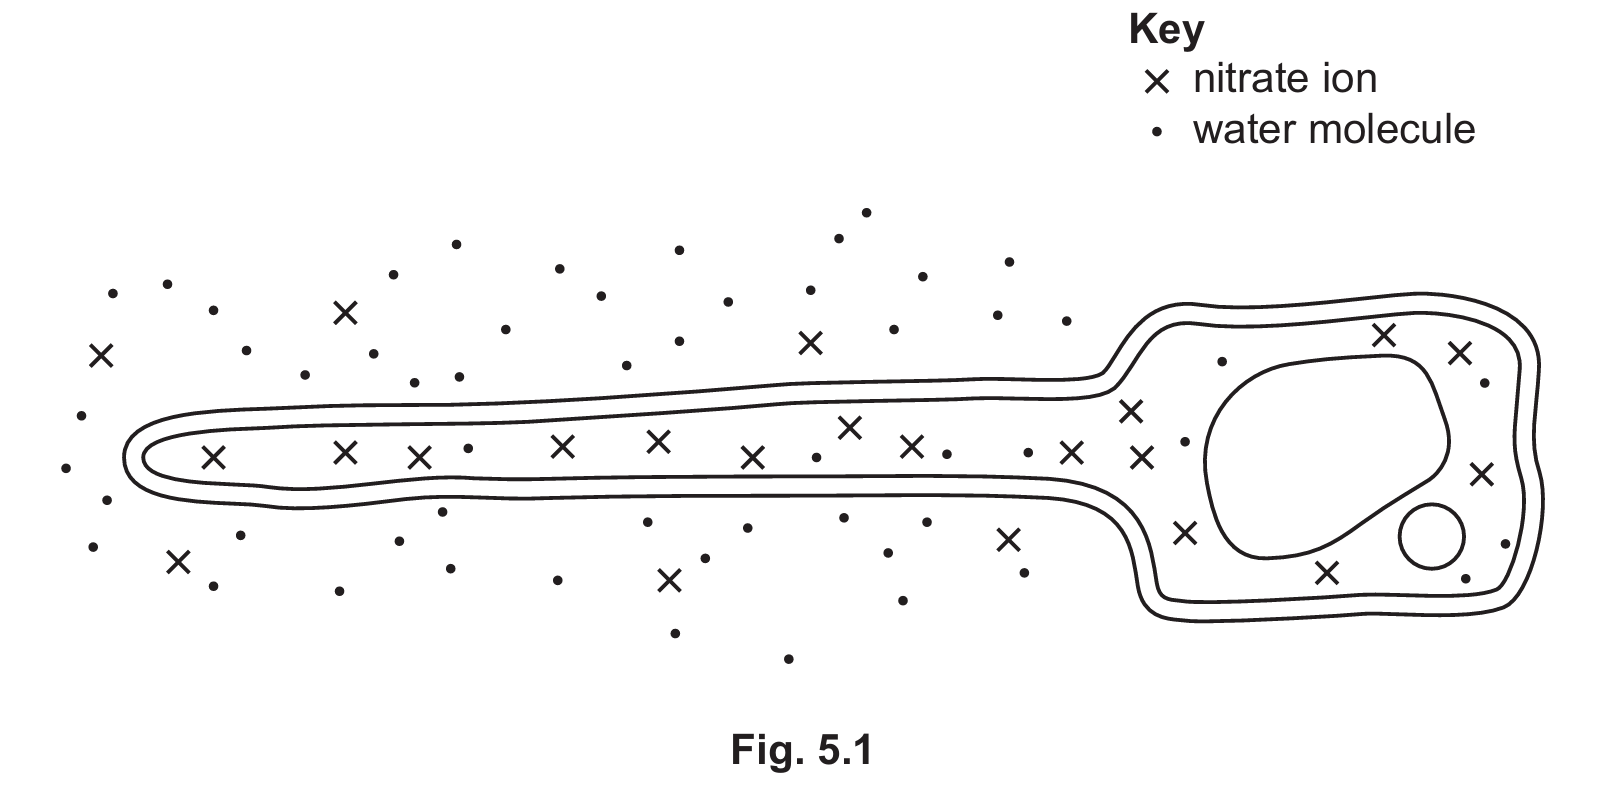
The process is active transport.
Explanation: By observing Fig. 5.1, you can see there are fewer nitrate ions ($\times$) outside the cell in the soil than inside the cell. Therefore, the ions must move from a region of low concentration to a region of high concentration (against the concentration gradient). This process requires energy (from respiration) and utilizes protein carriers located in the cell membrane.
(a)(ii)
1. Lightning
2. Nitrogen-fixing bacteria
(b)
Osmosis.
(c)
Differences:
• Nucleus: A root hair cell has a nucleus and a nuclear membrane, whereas a bacterial cell does not.
• DNA Structure: Root hair cells have linear DNA; bacteria have circular DNA and may have plasmids.
• Organelles: Root hair cells contain mitochondria and a large permanent vacuole; bacterial cells lack these membrane-bound organelles.
• Cell Wall: The root hair cell wall is made of cellulose, while the bacterial cell wall is made of a different substance (peptidoglycan).
Similarities:
• Both have a cell membrane.
• Both have cytoplasm.
• Both contain ribosomes.
• Both have a cell wall (though the composition differs).
• Both contain genetic material (DNA).