Home / iGCSE Biology (0610)-20.2 Habitat destruction – iGCSE Style Questions Paper 1

iGCSE Biology (0610)-20.2 Habitat destruction – iGCSE Style Questions Paper 1

Question

The diagram shows a food web.
At which trophic levels is the leopard feeding?
A first and second
B second and third
C second and fourth
D third and fifth
▶️ Answer/Explanation
Detailed solution

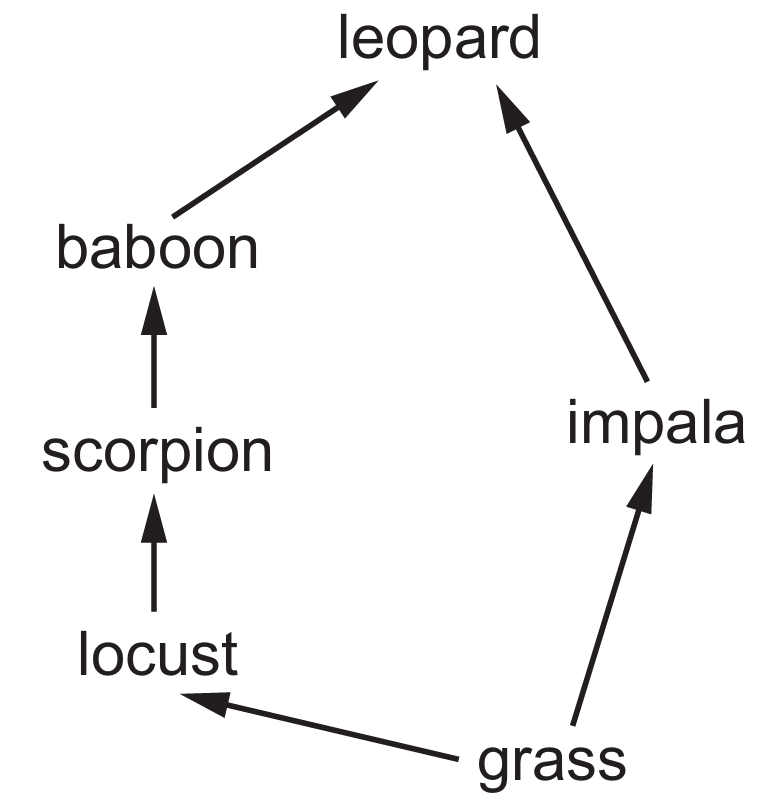
The correct answer is D.

Trophic levels are determined by counting steps from the producer (Grass, Level $1$). In the first path (Grass $\rightarrow$ Impala $\rightarrow$ Leopard), the leopard is the secondary consumer at the third level. In the second path (Grass $\rightarrow$ Locust $\rightarrow$ Scorpion $\rightarrow$ Baboon $\rightarrow$ Leopard), the leopard acts as the quaternary consumer at the fifth level. Therefore, the leopard occupies both the third and fifth trophic levels within this food web.

Question

Which statements describe the effects of deforestation?

1. Biodiversity increases.
2. The level of carbon dioxide in the atmosphere increases.
3. Soil is lost from the area.
4. There is a decrease in flooding.
(A) 1 and 2
(B) 1 and 4
(C) 2 and 3
(D) 3 and 4
▶️ Answer/Explanation
Deforestation removes trees that absorb \( \text{CO}_2 \), so statement 2 is correct: atmospheric \( \text{CO}_2 \) levels increase. Without tree roots to hold soil, erosion occurs, making statement 3 also correct. Biodiversity typically decreases (not increases) with habitat loss, so statement 1 is false. Flooding often increases because trees can no longer intercept rainfall and absorb water, so statement 4 is false. Thus, only statements 2 and 3 accurately describe deforestation effects.
Answer: (C)

Question

The graph shows the percentage of species lost, in three different animal groups, due to different human activities during the last ten years.

Which activity has caused the highest percentage of species loss overall?

(A) habitat loss
(B) exploitation
(C) pollution
(D) other factors
▶️ Answer/Explanation
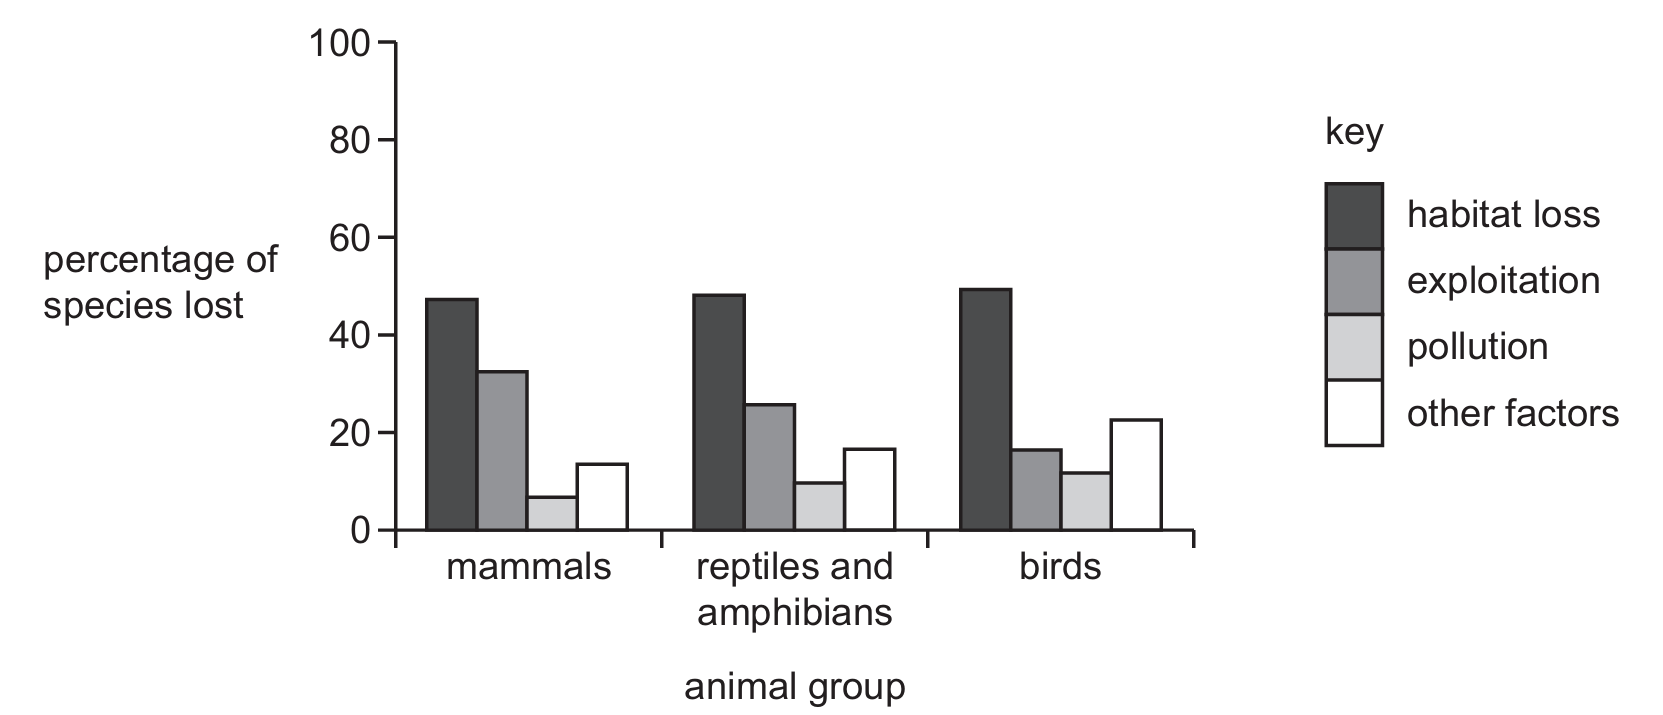
To determine the overall cause of the highest species loss, we must compare the bars across all three animal groups: mammals, reptiles and amphibians, and birds. In each group, the bar representing habitat loss (the darkest shaded bar) is significantly taller than the bars for exploitation, pollution, or other factors. For mammals and reptiles/amphibians, habitat loss accounts for approximately $48\%$ to $50\%$ of species lost, while for birds, it reaches nearly $50\%$. Since this category remains the dominant cause across every single group presented, it is the primary driver of species loss overall.
Answer: (A)
Scroll to Top