▶️ Answer/Explanation
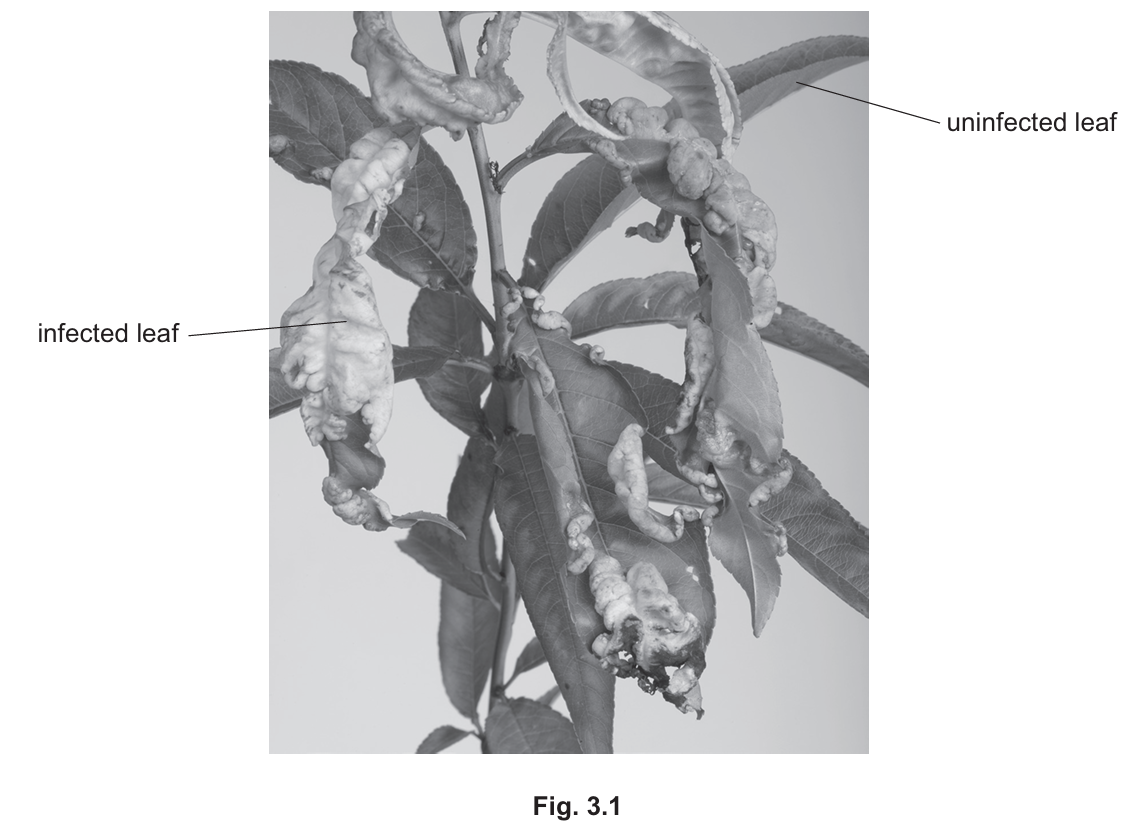
(a) (i) Two processes hindered by infection:
1. Photosynthesis: The physical deformation and possible loss of chlorophyll (chlorosis) in the infected leaf reduce its ability to capture light energy.
2. Gas exchange: Distortion of the leaf surface and potential blockage of stomata prevent the efficient movement of $CO_2$ and $O_2$.
(Other valid answers: Transpiration, transport of nutrients, or starch storage).
(a) (ii) Two types of pathogen:
1. Bacteria (e.g., Agrobacterium).
2. Viruses (e.g., Tobacco Mosaic Virus).
(Fungi or Protoctists are also acceptable).
(a) (iii) Transmission methods:
1. Direct contact: Branches, leaves, or roots of an infected tree physically touching a healthy tree.
2. Indirect vectors: Wind carrying spores, water runoff, or insects (like aphids) moving from one tree to another.
(b) Other causes of deforestation:
Deforestation is frequently driven by agricultural expansion (clearing land for crops or livestock), infrastructure development (building roads, housing, and factories), and logging for timber or fuel. Extraction of natural resources through mining is also a major contributor.
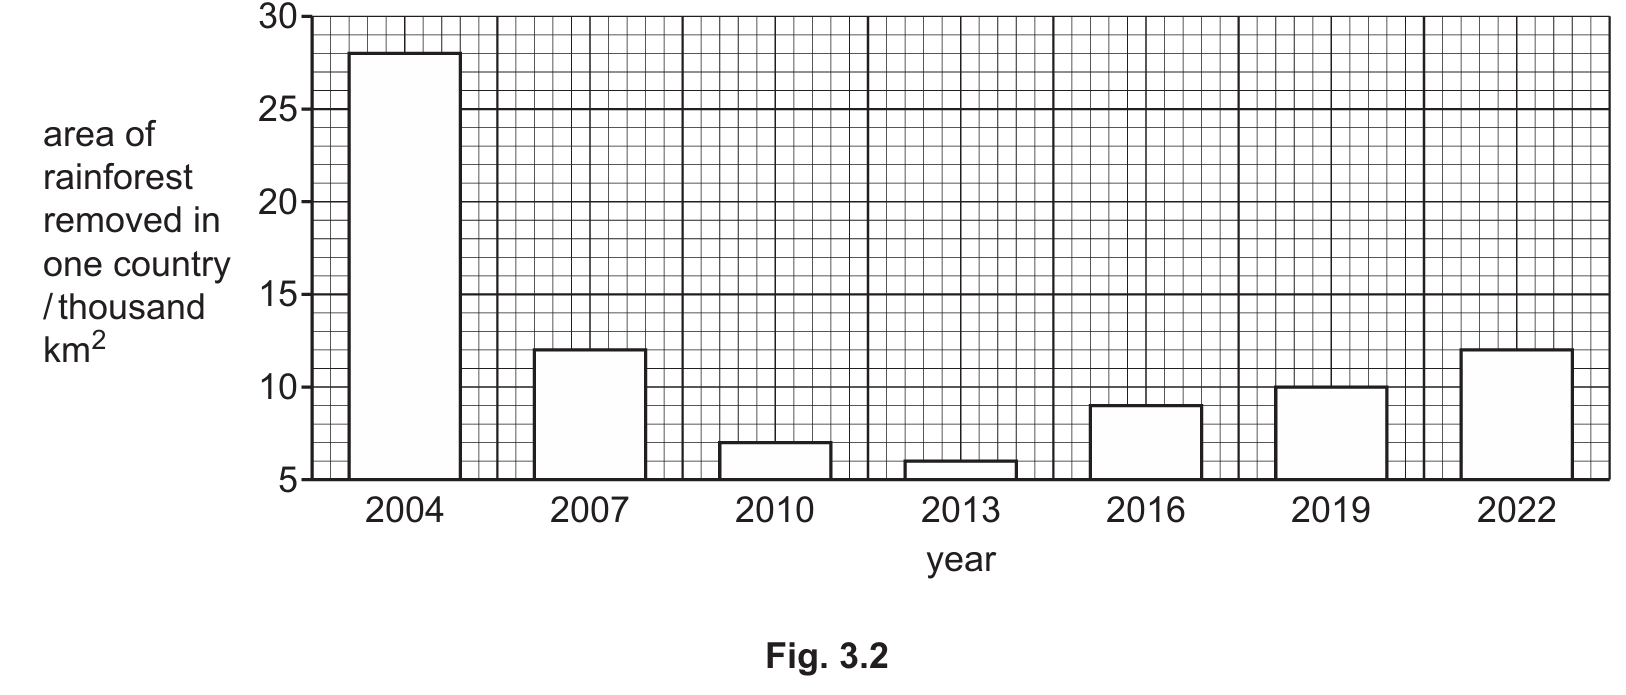
(c) Data Description (Fig. 3.2):
The data shows an overall decrease in the area of rainforest removed from $2004$ to $2022$. The removal peaked in $2004$ at approximately $28,000 \text{ km}^2$. There was a sharp decline until $2013$, reaching a minimum of about $6,000 \text{ km}^2$, followed by a steady increase back to $12,000 \text{ km}^2$ by $2022$.
(d) (i) Meaning of biodiversity:
Biodiversity refers to the number of different species present within a specific habitat or geographical area.
(d) (ii) Undesirable effects of deforestation:
Aside from biodiversity loss, deforestation leads to soil erosion (loss of fertile topsoil), increased risk of flooding due to reduced water uptake by roots, and an increase in atmospheric $CO_2$ levels, which accelerates the enhanced greenhouse effect and global warming.
In Part (a), the pathogen causes morphological changes. In biology, structure governs function; when the leaf curls and blisters, the palisade mesophyll cells (primary site of photosynthesis) are disrupted, and the stomatal distribution is altered, explaining why photosynthesis and transpiration fail.
For Part (c), analyzing the graph requires identifying the trend (decrease then increase), quoting extremes (max in $2004$, min in $2013$), and noting the rate of change (the initial drop was much steeper than the subsequent rise).