▶️ Answer/Explanation
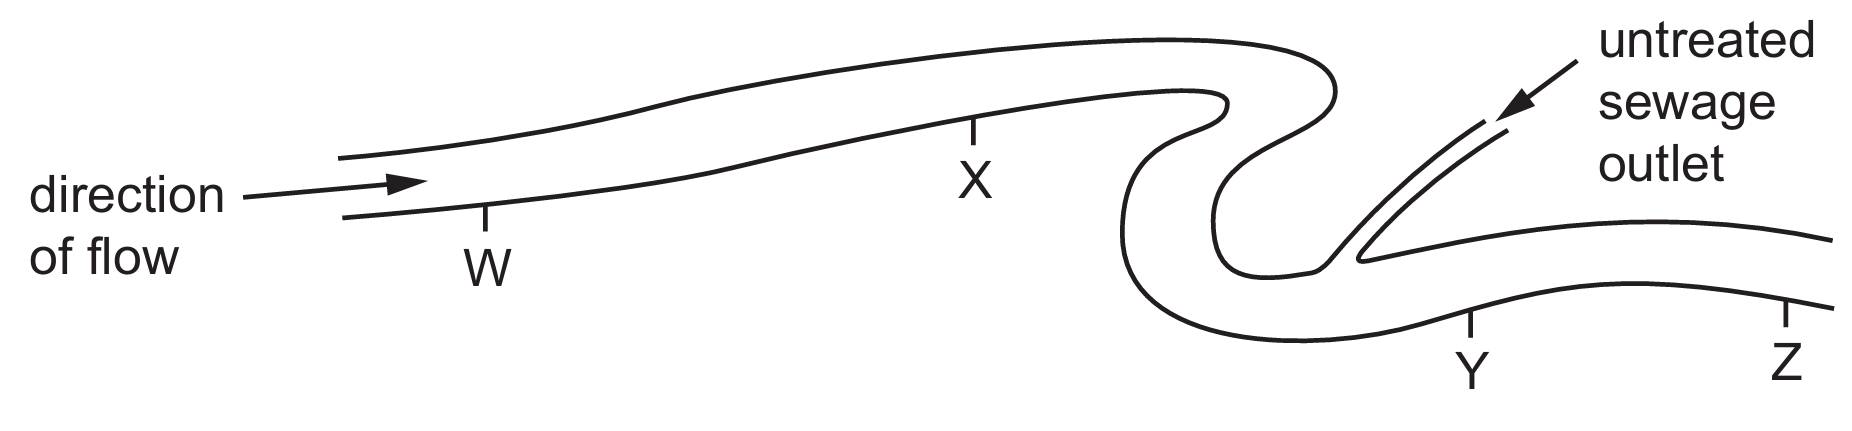
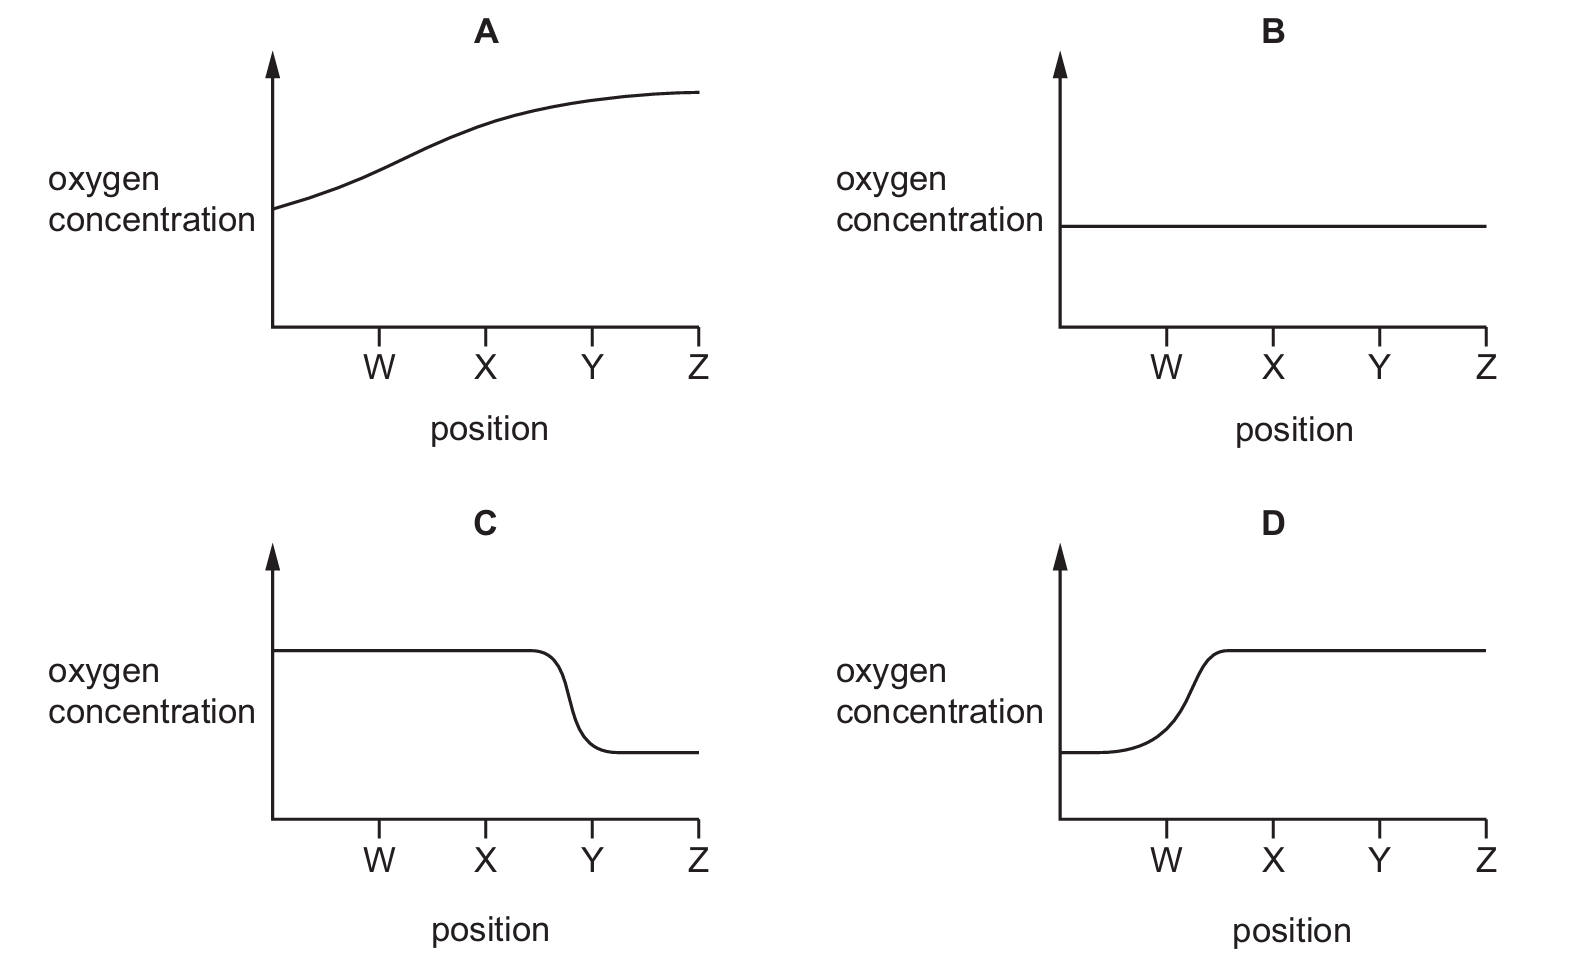
This question typically refers to the effect of organic pollution (sewage) entering a river. When organic waste is dumped into a river, aerobic bacteria begin to break it down. This process uses up a significant amount of dissolved oxygen, causing the concentration to drop sharply. As the water moves downstream and the waste is fully decomposed, the oxygen levels gradually recover through aeration. Graph $C$ correctly illustrates this “oxygen sag curve,” showing a sudden decrease in oxygen levels at position $Y$ followed by a lower equilibrium or recovery phase.
✅ Answer: (C)

▶️ Answer/Explanation
An acidic environment is defined as having a $pH$ value less than $7.0$. Looking at the provided graph, Species A has a survival range starting exactly at $pH$ $7.0$ and extending to $8.5$. Since no part of its survival bar falls below the neutral point of $7.0$, it cannot survive in acidic conditions. In contrast, Species B, C, and D all have survival bars that extend into the range below $7.0$ (e.g., Species C survives down to $pH$ $4.0$). Therefore, only Species A is strictly limited to neutral and alkaline environments.
✅ Answer: (A)
✅ Answer: (A)