▶️ Answer/Explanation
To determine how many statements are supported, we must look only at the provided graph:
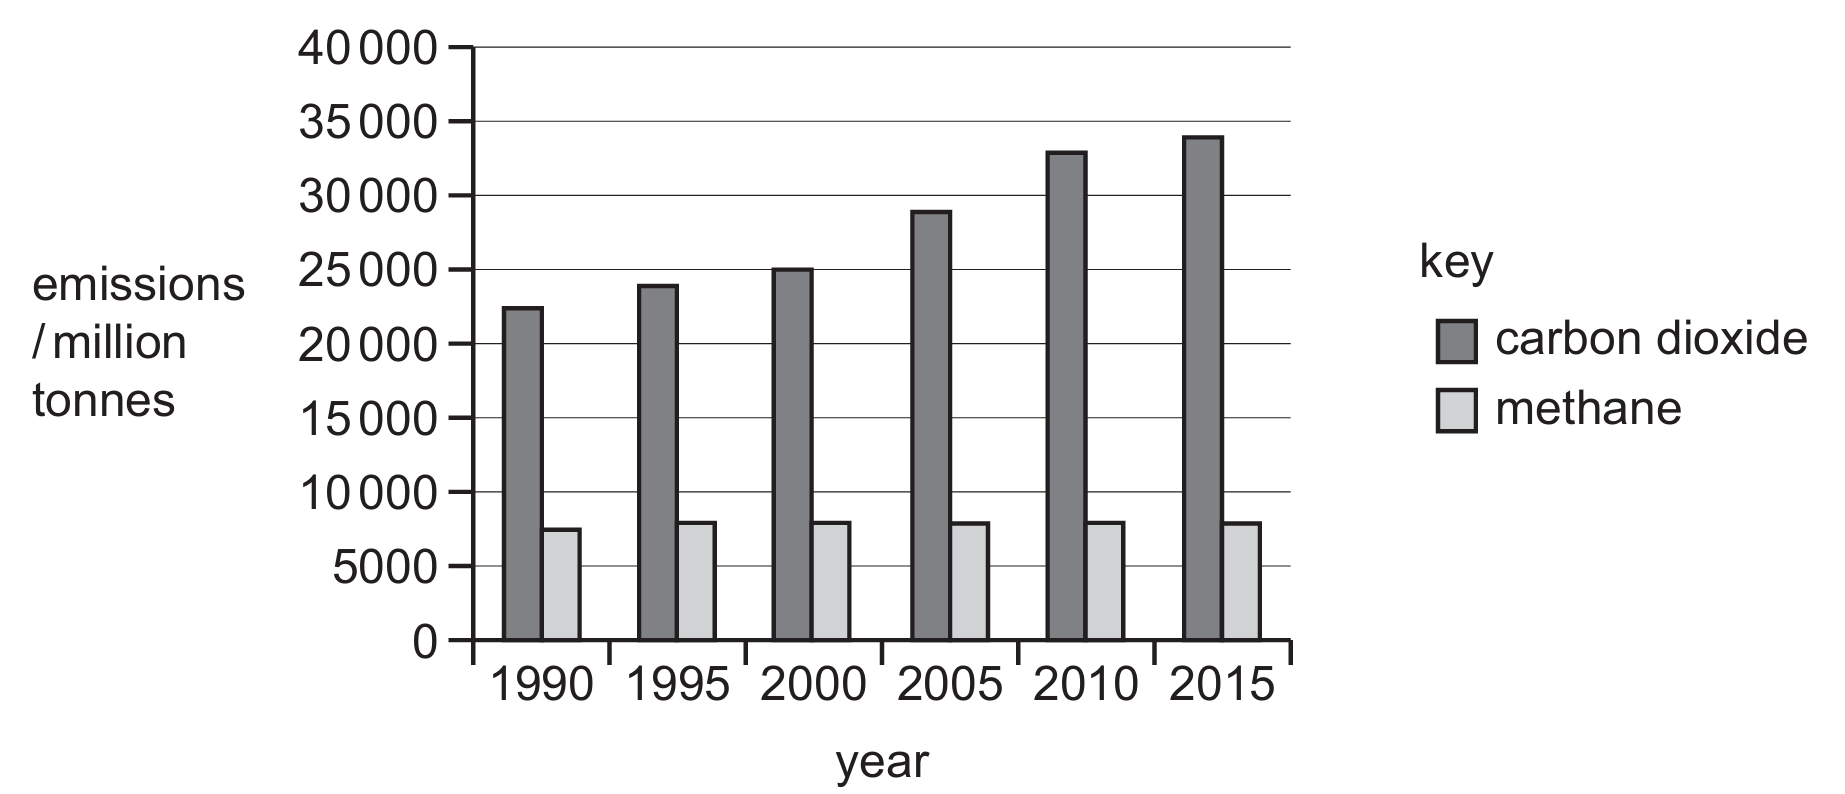
1. The graph only shows $CO_{2}$ and methane; it does not prove they were the only gases produced.
2. The data ends at $2015$, so it cannot support a claim about the “present day” (e.g., $2026$).
3. The graph shows emission quantity, not the potency or effect on climate change.
4. Looking at the bars, the methane bars are significantly shorter than the carbon dioxide bars for every year shown ($1990–2015$).
Therefore, only the final statement is supported by the visual data provided.
✅ Answer: (A)
▶️ Answer/Explanation
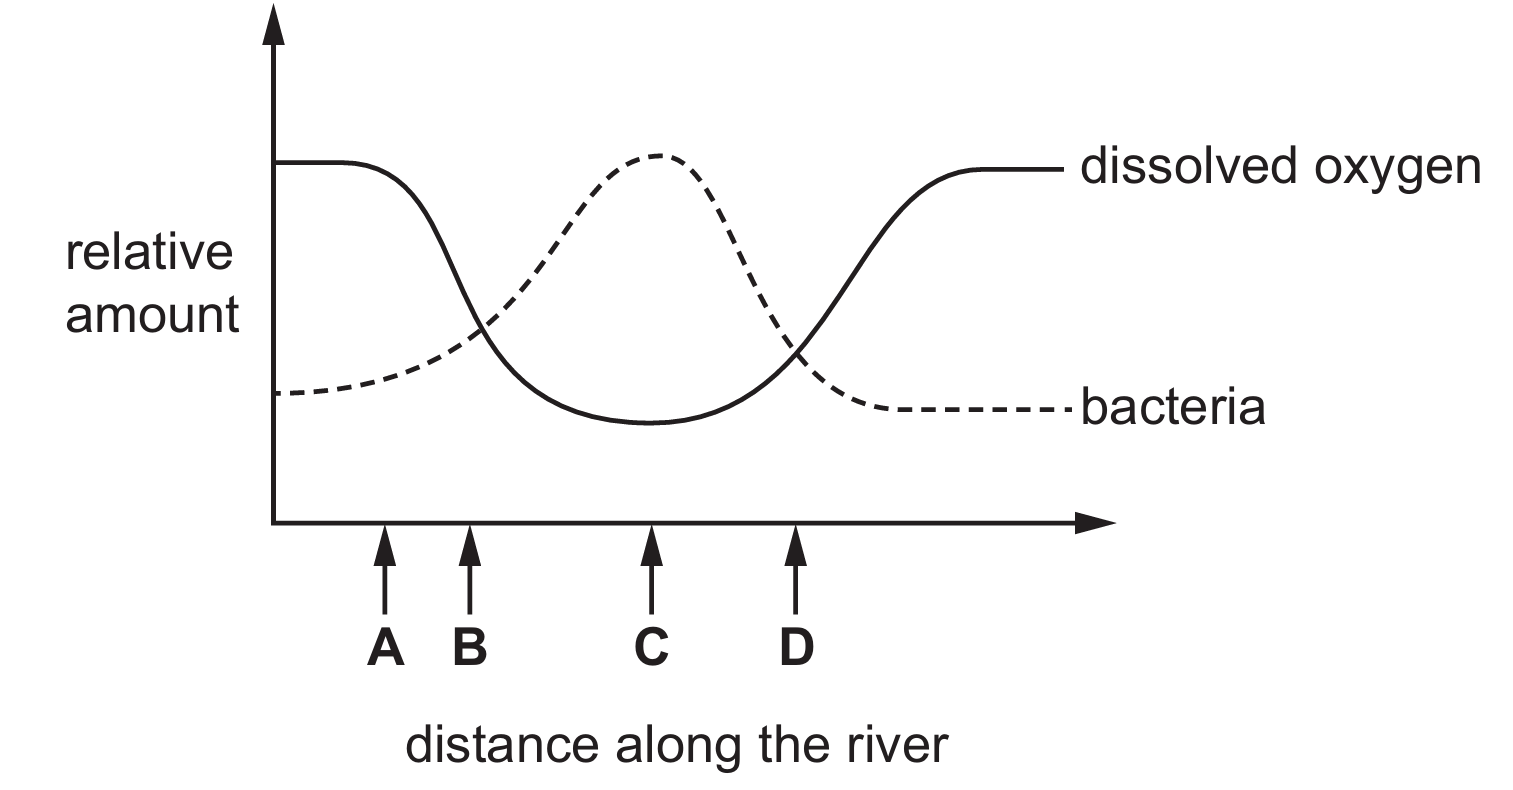
When fertiliser enters a river, it causes an immediate increase in nutrient levels, leading to rapid growth of algae and subsequent death of plants. Bacteria then decompose this organic matter, and their population increases significantly. Because these bacteria are aerobic, they consume large amounts of dissolved oxygen for respiration, causing oxygen levels to plummet.
Looking at the graph, the point where the bacteria curve starts its sharp ascent and the oxygen curve begins its steep decline is at position A. At positions $B$ and $C$, the impact is already in progress or at its peak, while $D$ shows the recovery phase. Therefore, the point of entry must be the earliest point where these changes are triggered.
✅ Answer: (A)