▶️ Answer/Explanation
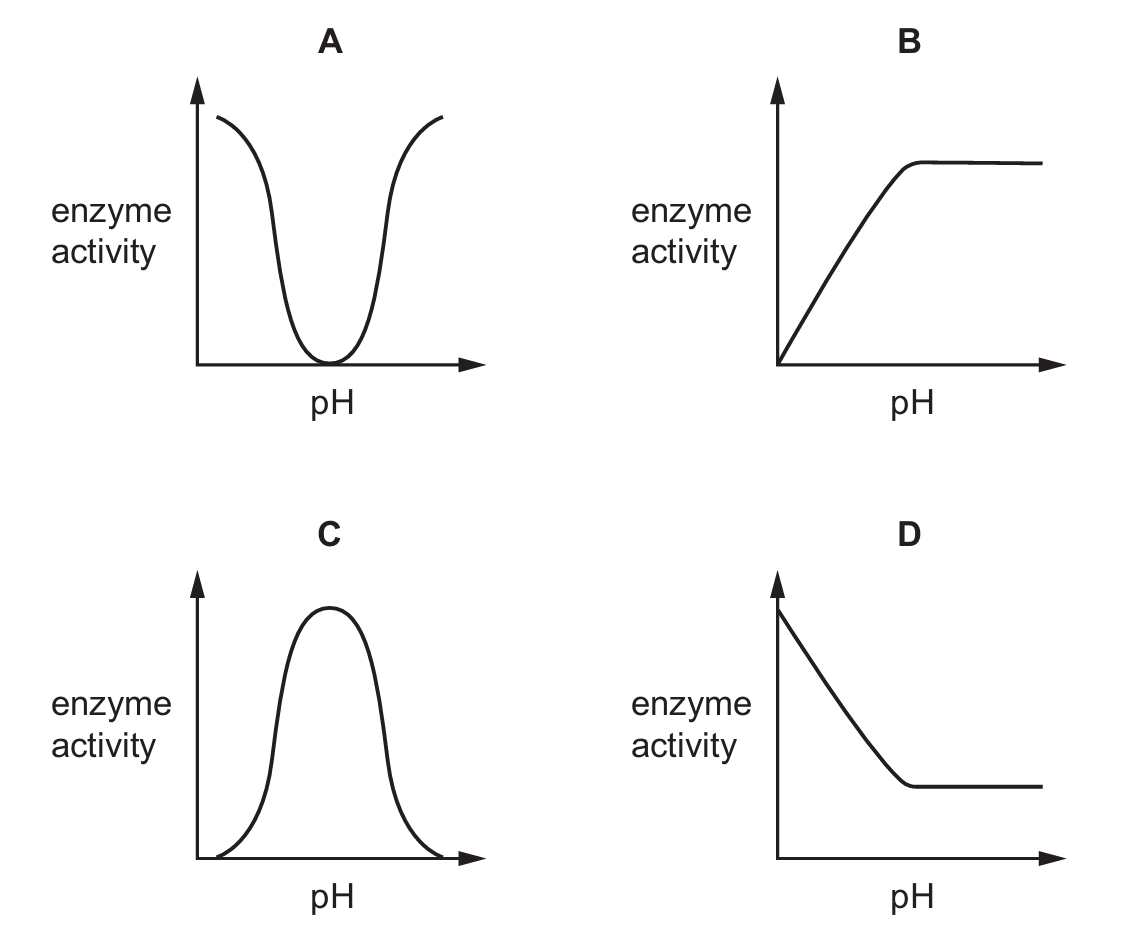
Enzymes have an optimum $pH$ at which they function most efficiently. As the $pH$ moves away from this optimum—either becoming too acidic or too alkaline—the chemical bonds holding the enzyme’s active site together begin to break. This leads to denaturation, where the active site changes shape and the substrate can no longer fit.
Consequently, enzyme activity is highest at the peak and drops off to zero on either side, creating a characteristic bell-shaped curve. Graph C correctly illustrates this relationship, showing a single clear peak of maximum activity.
✅ Answer: (C)
▶️ Answer/Explanation
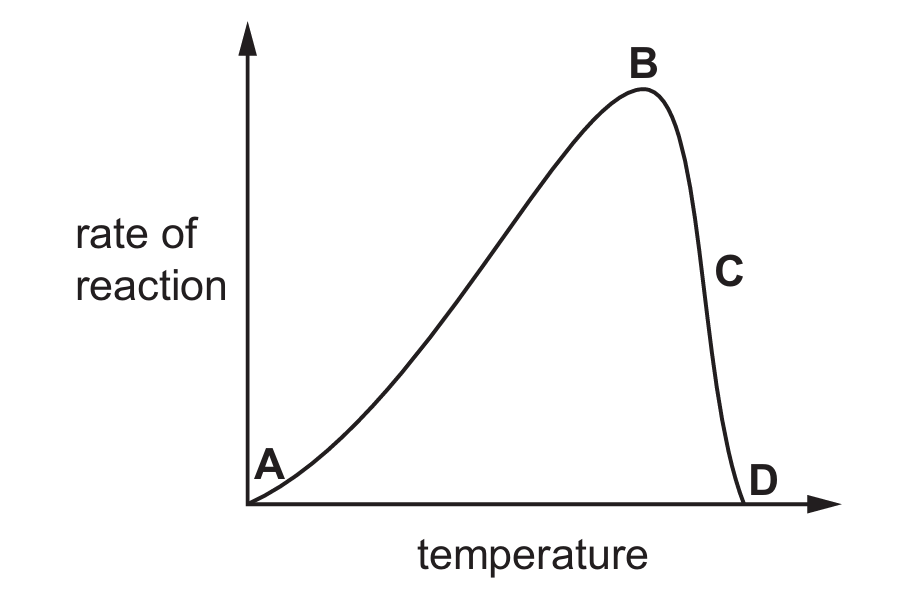
✅ Answer: (D)
▶️ Answer/Explanation
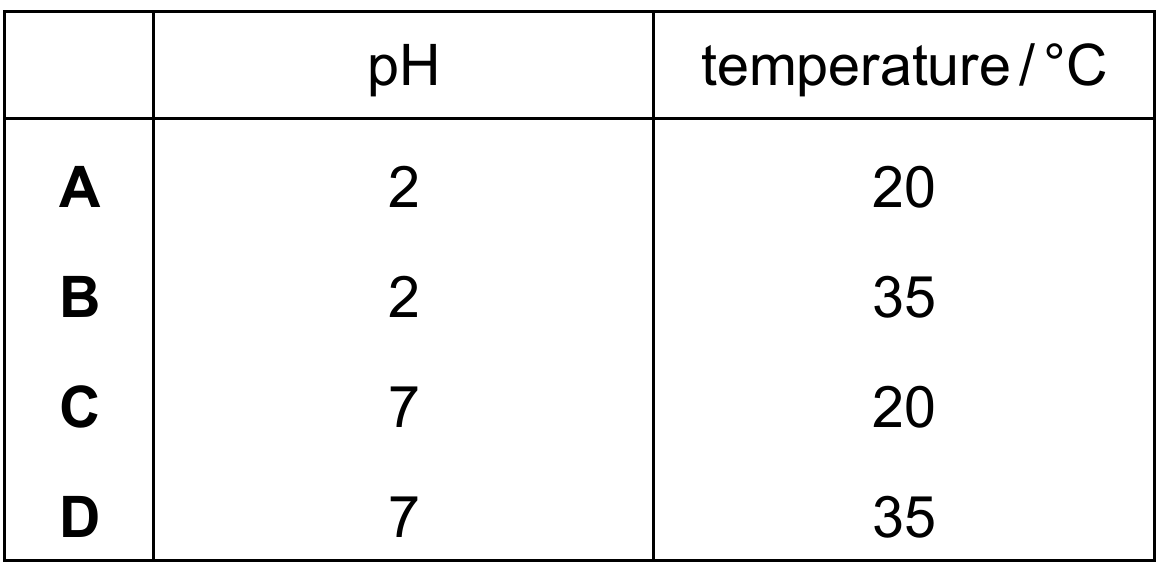
The correct answer is B.
Stomach enzymes like Enzyme R (pepsin) function optimally in highly acidic conditions ($pH \text{ } 2$) created by gastric acid. Furthermore, enzymatic reactions accelerate as temperature increases toward the human biological optimum of approximately $37^\circ\text{C}$ due to increased molecular collisions. While test-tube A has the correct pH, its lower temperature ($20^\circ\text{C}$) results in a slower reaction. Test-tube B provides the ideal combination of an acidic environment and a near-body temperature ($35^\circ\text{C}$), ensuring the highest rate of protein digestion.