
▶️ Answer/Explanation
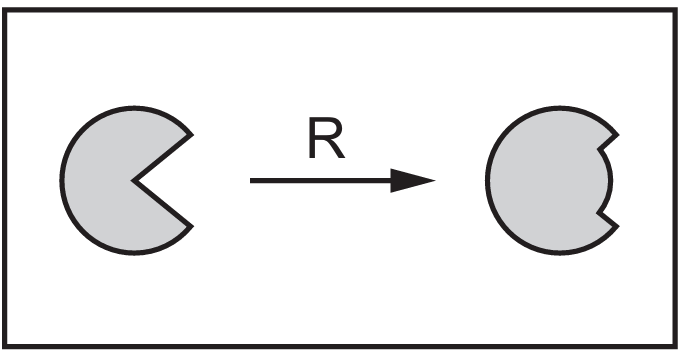
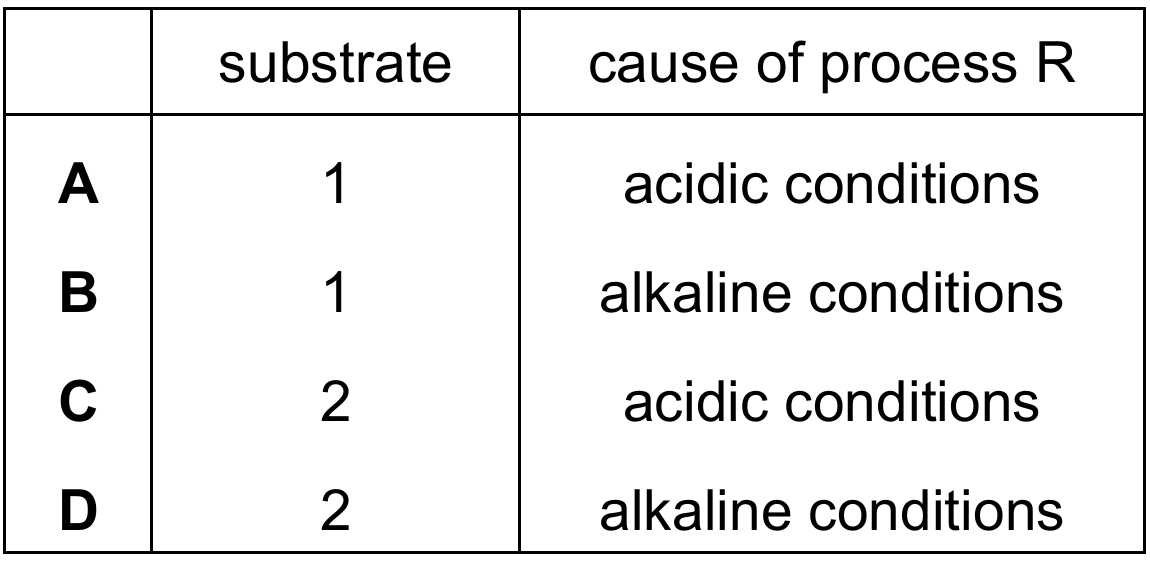
In the first diagram, the molecule labeled $1$ is the substrate because it binds to the enzyme’s active site and is broken down into products labeled $2$. Since the enzyme is located in the human stomach, it is likely pepsin, which functions optimally in acidic conditions ($pH$ $2$). Process $R$ shows the active site changing shape, a process known as denaturation. This happens when the enzyme is exposed to unfavorable conditions, such as alkaline conditions, which would disrupt the enzyme’s structure and render it inactive.
✅ Answer: (B)
✅ Answer: (B)
▶️ Answer/Explanation
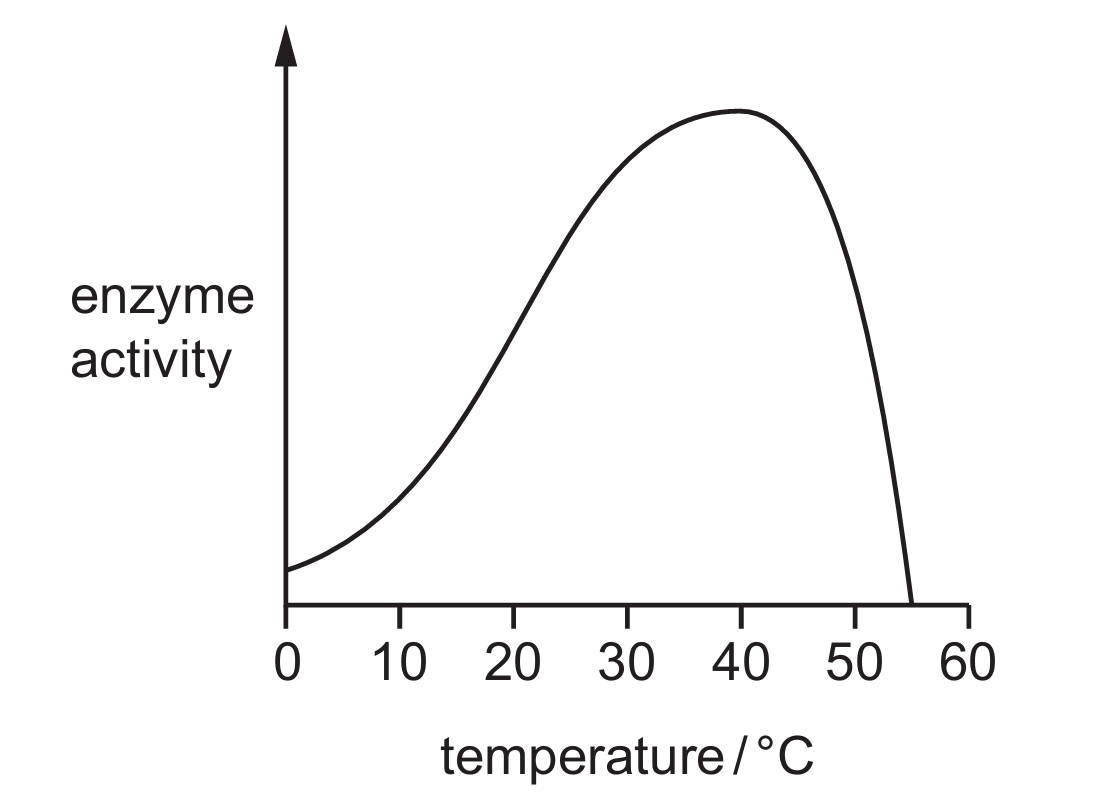
Enzymes are proteins with specific 3D shapes, including an active site perfectly molded for a substrate. As temperature rises beyond the optimum (approx. $40$ °C in this graph), the increased kinetic energy causes the chemical bonds holding the protein together to vibrate and eventually break. This process, called denaturation, alters the shape of the active site. Because the substrate can no longer fit into the changed active site, the rate of reaction drops sharply. Note that enzymes are biological molecules, not living organisms, so they are “denatured” rather than “killed.”
✅ Answer: (D)
✅ Answer: (D)