▶️ Answer/Explanation
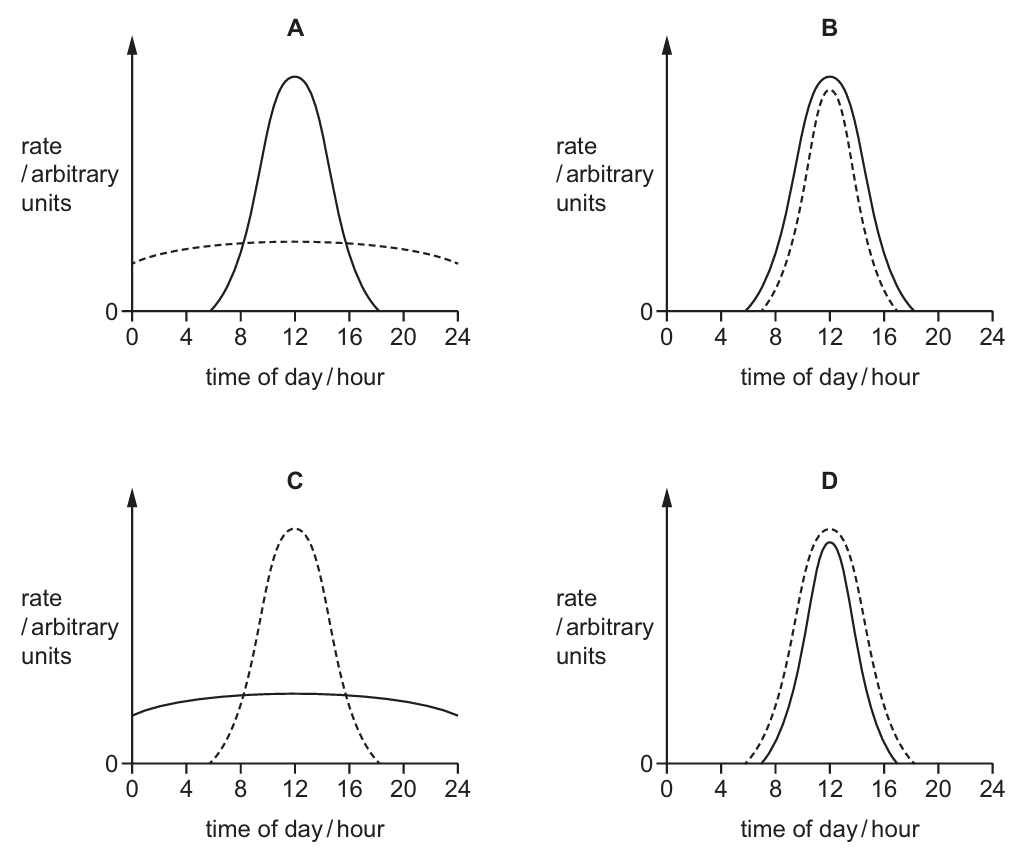
Photosynthesis is a light-dependent process; therefore, its rate is zero during the night and peaks at midday ($12$ hours) when light intensity is highest. Respiration, however, is a continuous process that occurs in all living cells $24$ hours a day to provide energy for survival. While the rate of respiration may fluctuate slightly with temperature changes, it remains relatively constant compared to the dramatic spikes in photosynthesis. Graph A correctly depicts photosynthesis as a bell curve peaking at noon and respiration as a steady, ongoing line throughout the entire $24$-hour cycle. The other graphs incorrectly suggest that respiration stops in the dark or follows light intensity identically.
✅ Answer: (A)
✅ Answer: (A)
▶️ Answer/Explanation
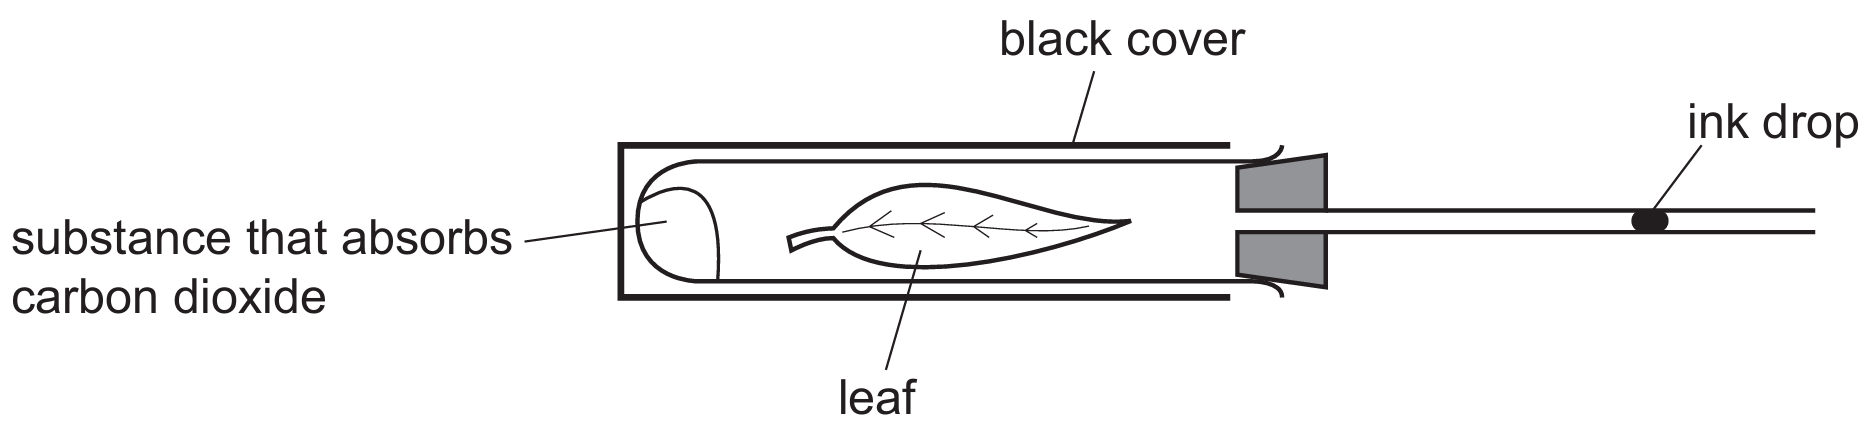
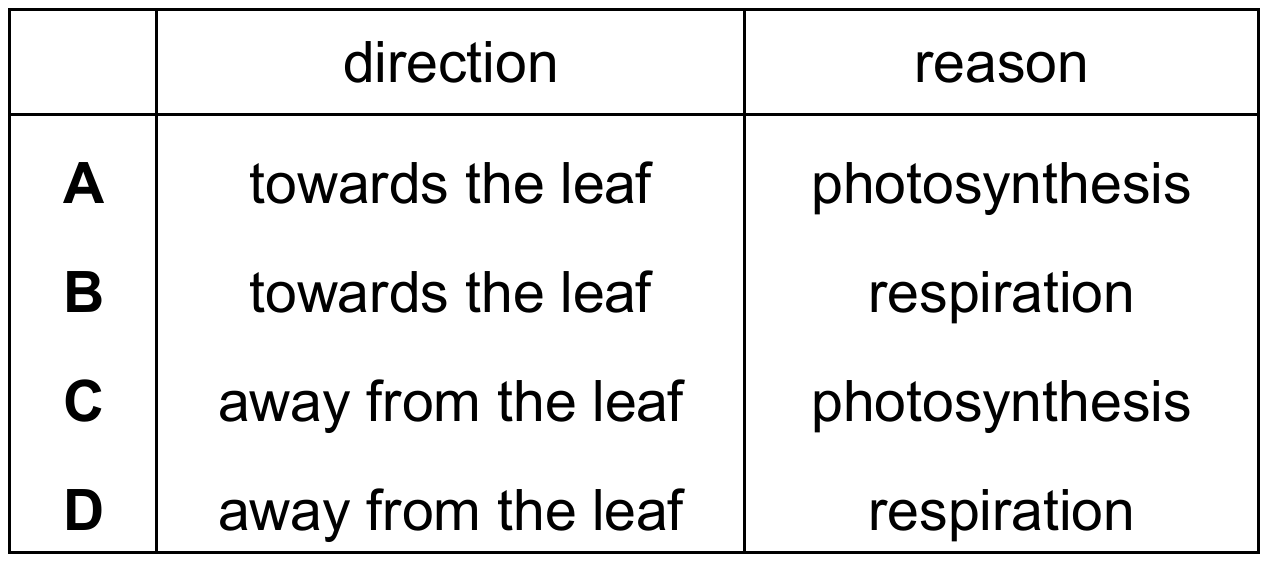
In this setup, the black cover prevents light from reaching the leaf, meaning photosynthesis cannot occur. Consequently, the leaf only undergoes aerobic respiration, taking in oxygen ($O_2$) and releasing carbon dioxide ($CO_2$). The substance in the tube absorbs any $CO_2$ produced, meaning there is a net decrease in the volume of gas inside the sealed tube as $O_2$ is consumed. This drop in internal pressure pulls the ink drop towards the leaf to equalize the pressure. Therefore, the movement is caused by the depletion of gas during respiration.
✅ Answer: (B)
✅ Answer: (B)