▶️ Answer/Explanation
(a) Word equation for photosynthesis:
\[\text{carbon dioxide} + \text{water} \xrightarrow{\text{light, chlorophyll}} \text{glucose} + \text{oxygen}\]
Note: The arrow typically signifies the presence of light energy and chlorophyll, which are required for the reaction but are not reactants themselves. [cite: 335]
(b)(i) Structure for photosynthesis:
Chloroplasts. [cite_start]These are the organelles within plant cells that contain the machinery necessary for photosynthesis. [cite: 250, 335]
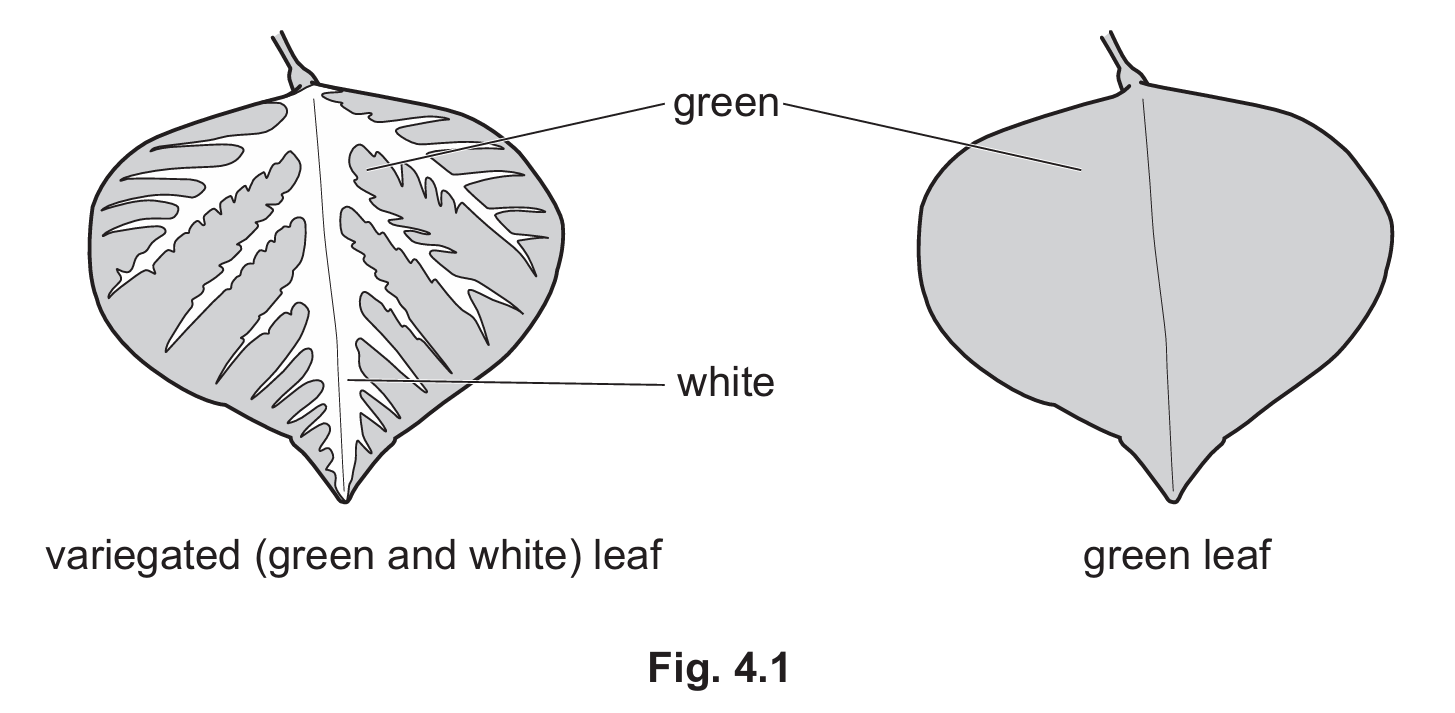
(b)(ii) Pigment name:
Chlorophyll. This is the green pigment responsible for absorbing light energy. [cite_start]It is absent in the white areas of a variegated leaf. [cite: 335]
(c)(i) Percentage decrease calculation:
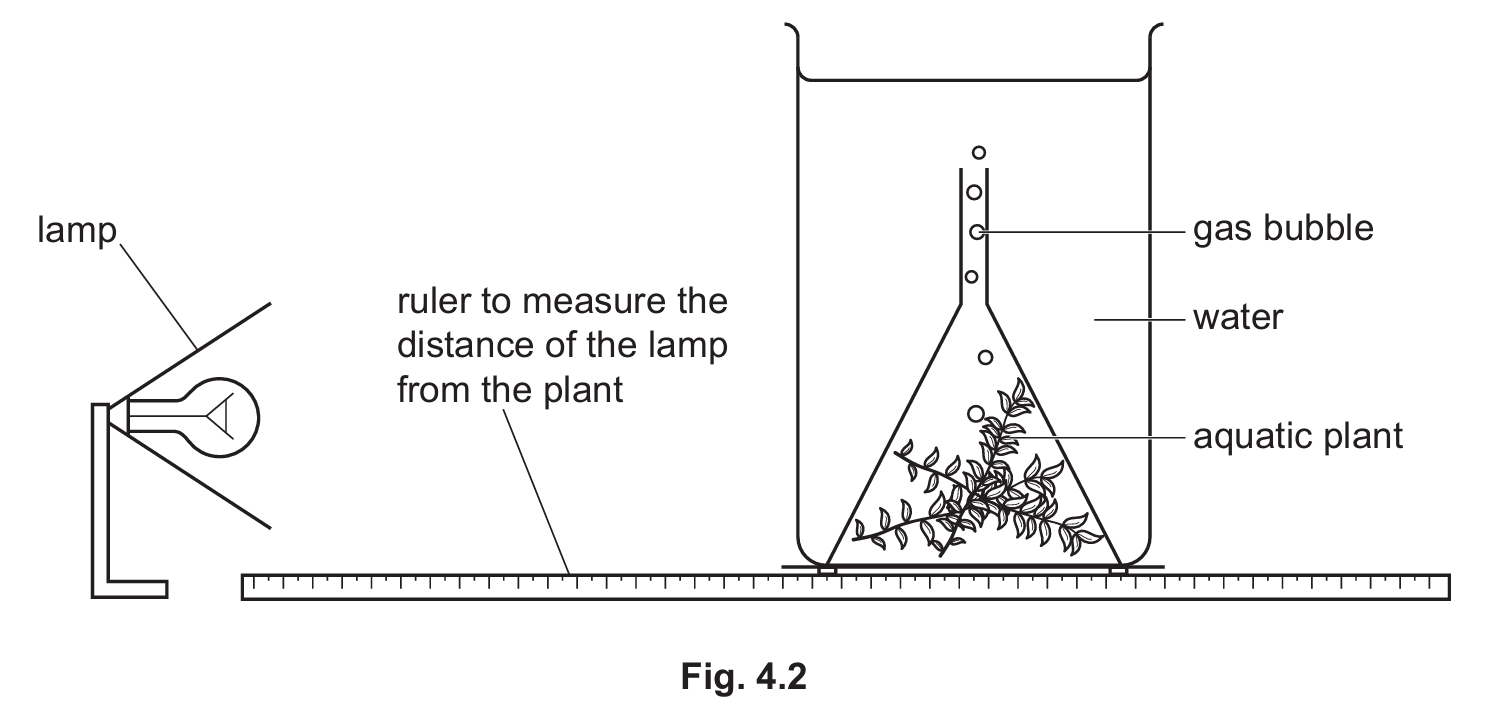
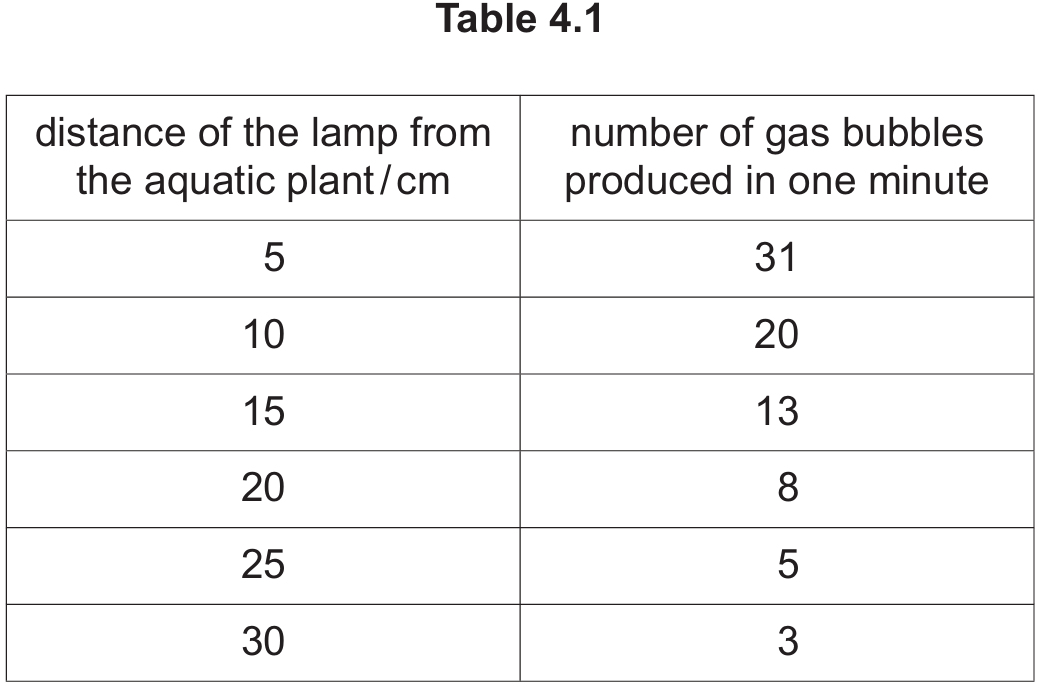
First, identify the number of bubbles at the two specified distances from Table 4.1:
- At \(15 \, \text{cm}\): \(13\) bubbles
- At \(30 \, \text{cm}\): \(3\) bubbles
Calculate the decrease in the number of bubbles: \[\text{Decrease} = 13 – 3 = 10\] Calculate the percentage decrease relative to the starting value (\(15 \, \text{cm}\)): \[\text{Percentage Decrease} = \frac{\text{Decrease}}{\text{Original Value}} \times 100\] \[= \frac{10}{13} \times 100 \approx 76.92\%\] Rounded to a whole number: 77%.
(c)(ii) Describe and explain the results:
Description (What the data shows):
- There is a negative correlation between distance and the rate of bubbling. [cite_start]As the distance of the lamp from the plant increases, the number of gas bubbles produced per minute decreases. [cite: 351]
- For example, at \(5 \, \text{cm}\) there are \(31\) bubbles, dropping to only \(3\) bubbles at \(30 \, \text{cm}\).
Explanation (Why it happens):
- Light Intensity: Light is a limiting factor for photosynthesis. [cite_start]As the lamp moves further away, the light intensity reaching the plant decreases (following the inverse square law). [cite: 351][cite_start]
- Photosynthesis Rate: Less light energy means less energy is available to drive the photosynthetic reaction. [cite: 335]
- Oxygen Production: The bubbles are composed of oxygen gas, which is a product of photosynthesis. [cite_start]Therefore, a lower rate of photosynthesis results in less oxygen being released, leading to fewer bubbles. [cite: 335]