
▶️ Answer/Explanation
Detailed solution
(a) (i)
The label line X must point to the thick muscular wall of the left ventricle. (Note: The left ventricle is on the right side of the diagram, characterised by a thicker wall compared to the right ventricle).
(a) (ii)
The path of blood from A (Vena Cava) to B (Pulmonary Artery) is as follows:
- Blood enters the right atrium from A.
- It moves into the right ventricle.
- It passes through a valve (specifically the tricuspid valve into the ventricle, or the semilunar valve out of the ventricle) to exit via B.
(a) (iii)
Pulmonary vein. (This vessel carries oxygenated blood from the lungs back to the left atrium).
(b) (i)
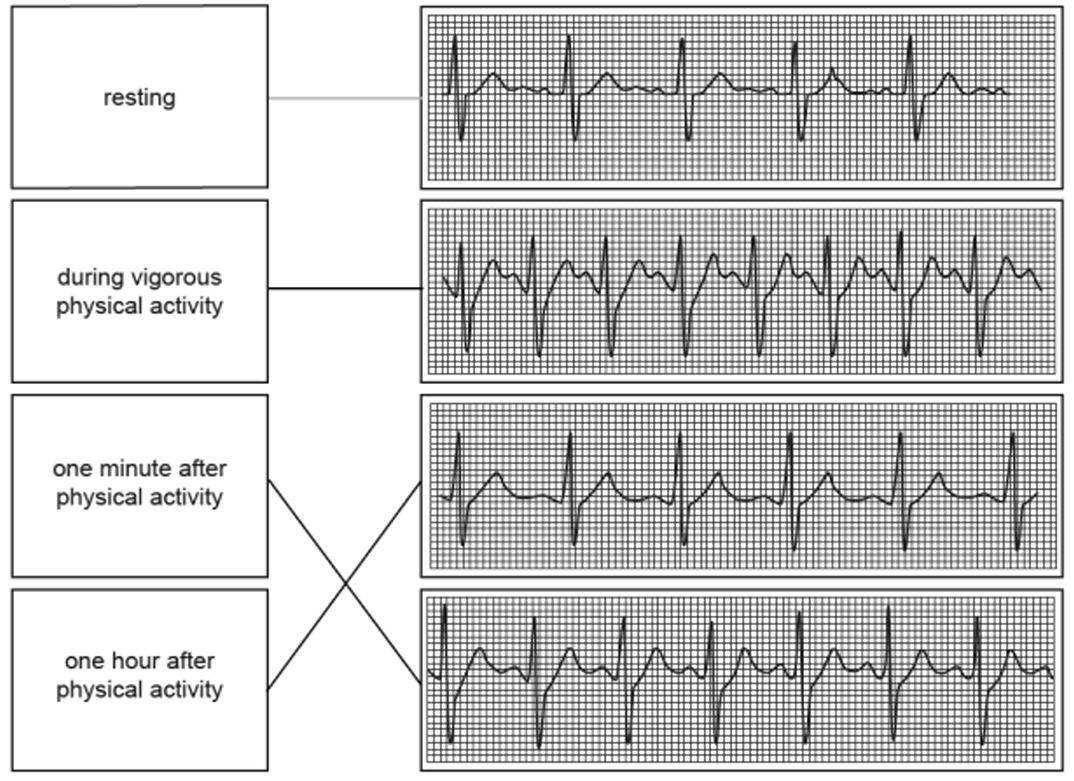
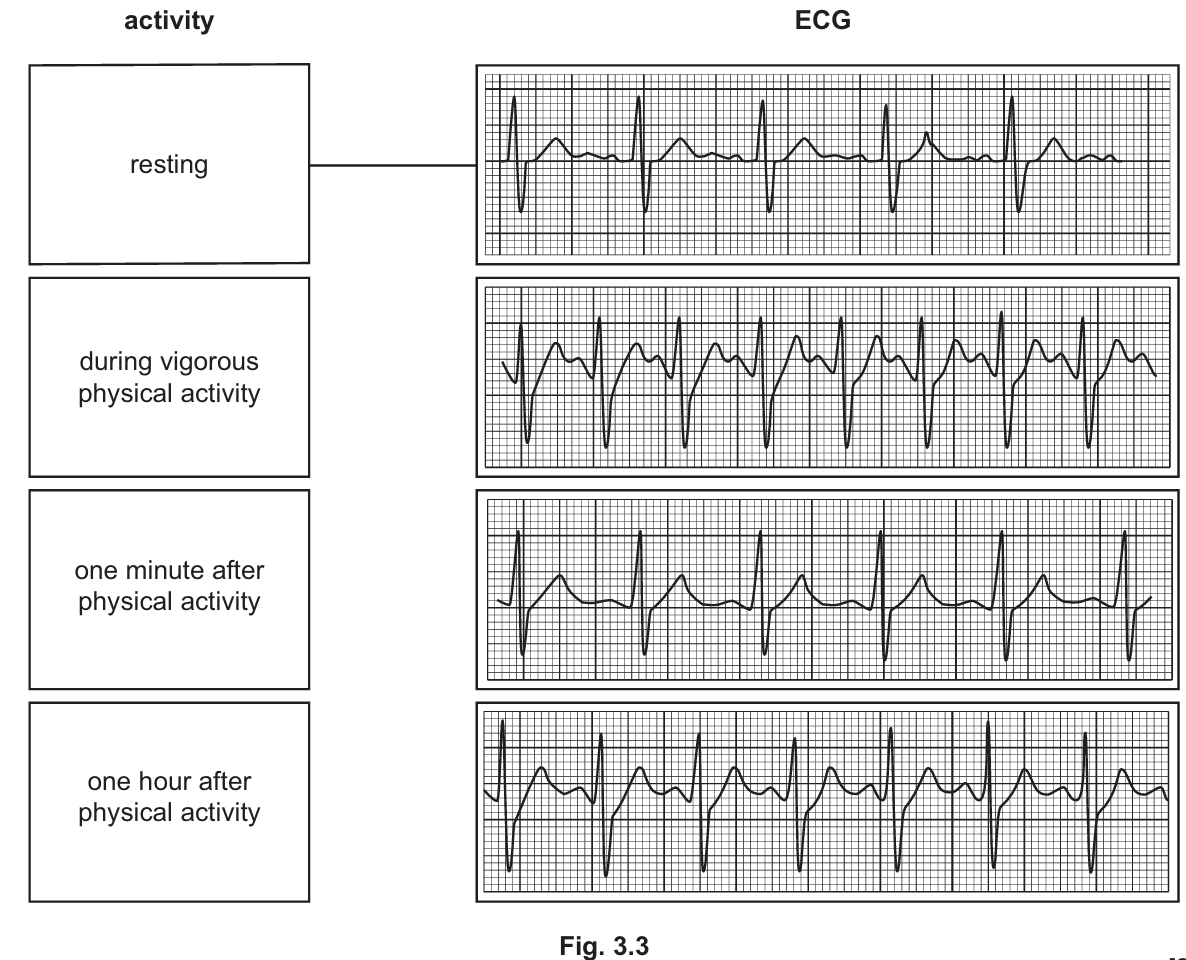
Matching the activity to the ECG trace:
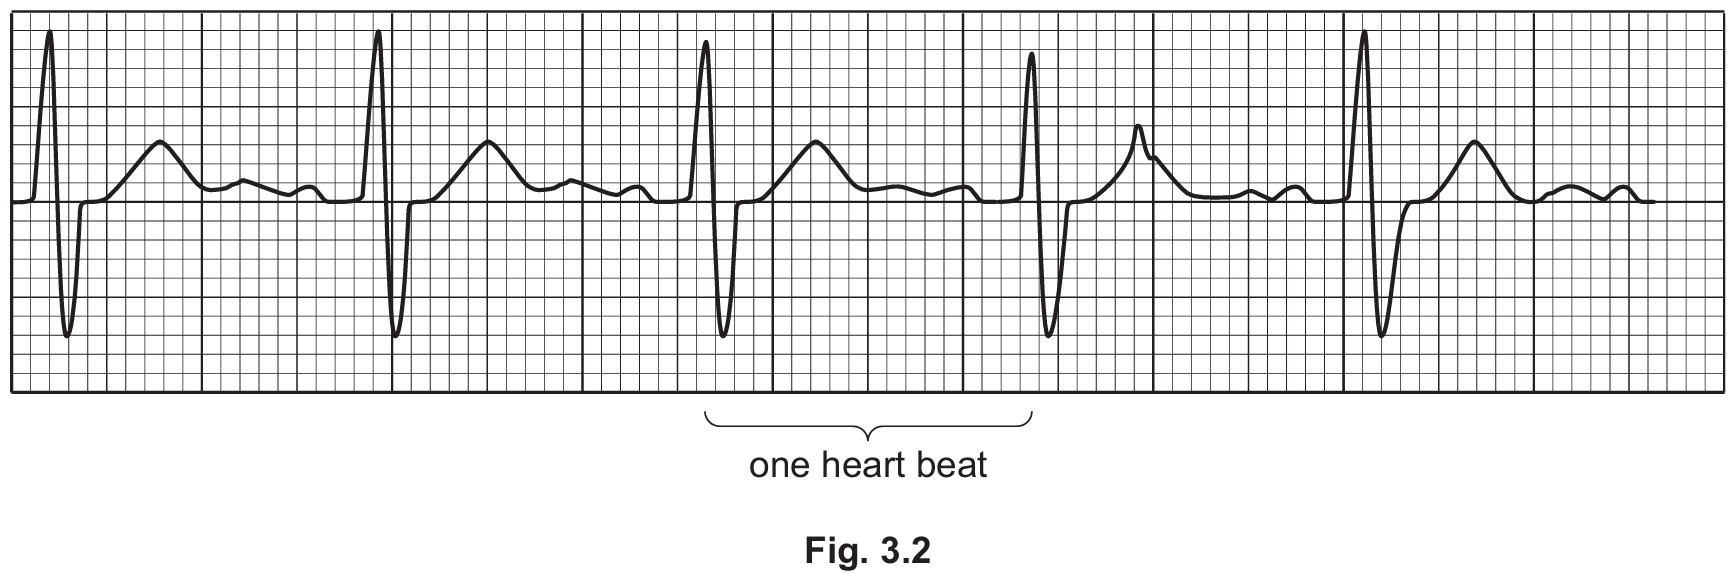
- Resting: Top graph (Normal/slow rhythm) — (Already matched in question).
- During vigorous physical activity: 2nd graph down (The peaks are closest together, indicating the fastest heart rate).
- One minute after physical activity: 3rd graph down (The heart rate is slowing down but is still faster than resting).
- One hour after physical activity: Bottom graph (The heart rate has returned to the resting rate).
(b) (ii)
Any two of the following:
- Counting the pulse rate.
- Listening to the sound of the valves (using a stethoscope).
- Measuring blood pressure (AVP).
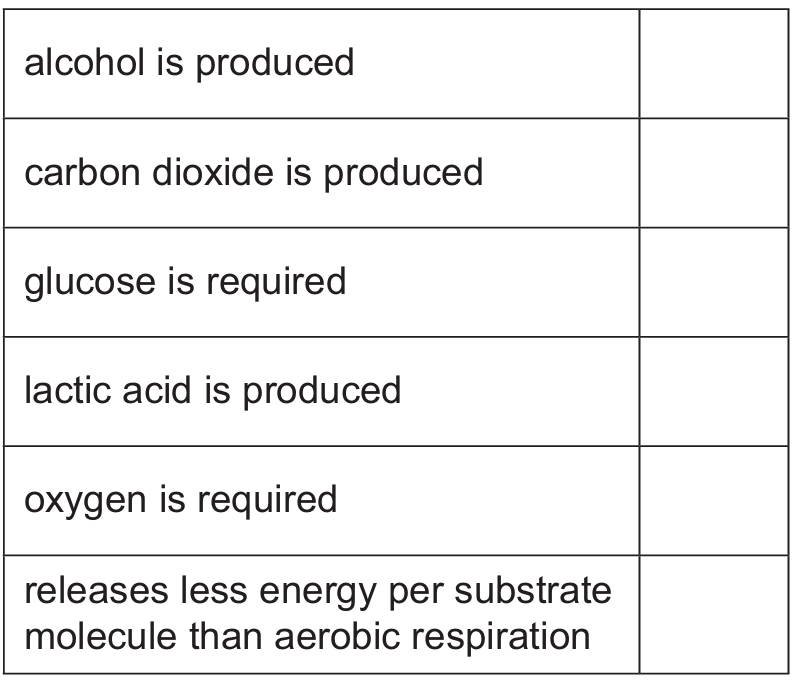
(c) (i)
The correct statements for anaerobic respiration in humans are:
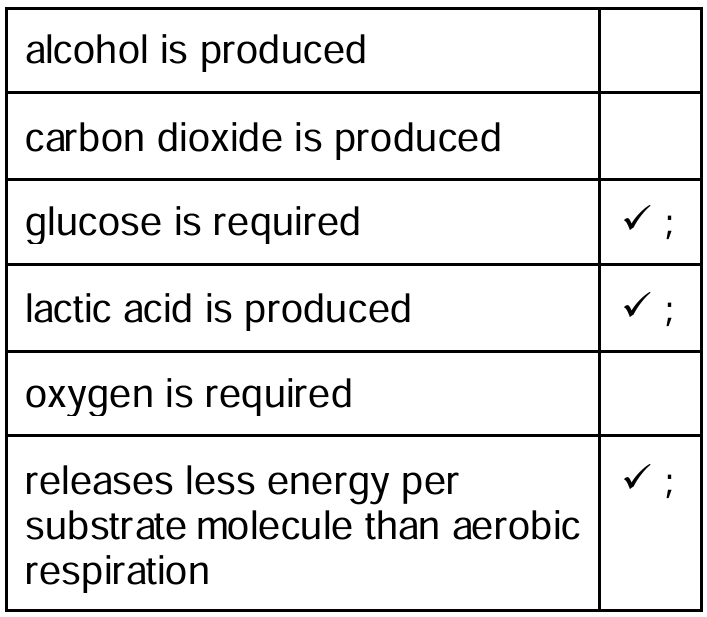
Note: Alcohol and carbon dioxide are produced during anaerobic respiration in yeast (fermentation), not humans.
(c) (ii)
Vigorous exercise causes an:
- Increase in the rate of breathing.
- Increase in the depth of breathing.