(a) One day a survey is taken of the ages of 120 children at a fairground.
The results are shown in the frequency table.
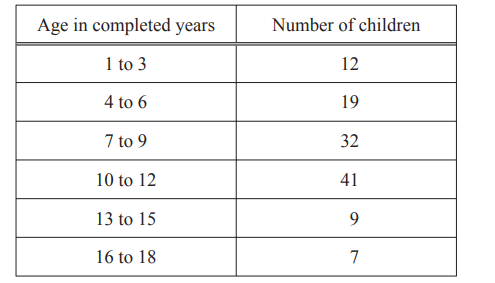
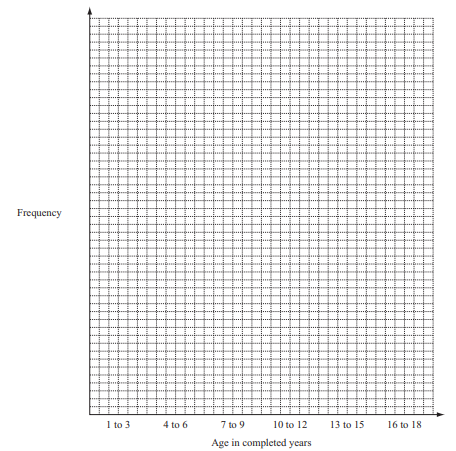
(i) On the grid, draw a bar chart for this data.
Complete the scale on the frequency axis.
(ii) What is the modal age group?
(iii) One of the 120 children is chosen at random.
Write down the probability that the child is aged 4 to 6.
(b) Lalia says the probability of taking a yellow bead from a bag containing yellow beads and black beads is \(\frac{7}{5}.\)
Explain why \(\frac{7}{5}\) cannot be a correct probability
(c) Another bag contains 9 green marbles and 11 red marbles.
A marble is taken at random.
Write down the probability that the marble is
(i) green,
(ii) blue.
▶️ Answer/Explanation
(a)(i) Ans: Correct diagram with scale
Draw bars for each age group (4-6: height 19, 7-9: height 28, 10-12: height 42, 13-15: height 31). Label frequency axis up to at least 42.
(a)(ii) Ans: 10 to 12 cao
The modal age group is the one with the highest frequency. Here, 10-12 has 42 children, which is the largest.
(a)(iii) Ans: \(\frac{19}{120}\) or 0.158[3….] or 15.8[3……]%
Probability = \(\frac{\text{Frequency of 4-6}}{\text{Total children}} = \frac{19}{120}\).
(b) Ans: Probability must be between 0 and 1 oe
\(\frac{7}{5} = 1.4\), which exceeds 1. Probabilities range from 0 (impossible) to 1 (certain).
(c)(i) Ans: \(\frac{9}{20}\) or 0.45 or 45%
Total marbles = 9 green + 11 red = 20. P(green) = \(\frac{9}{20}\).
(c)(ii) Ans: 0 oe
There are no blue marbles, so the probability is 0.
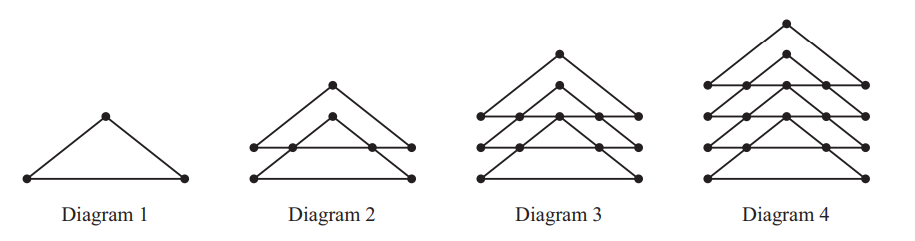
Diagrams 1 to 4 show a sequence of shapes made up of lines and dots at the intersections of lines.
(a) (i) Complete the table showing the number of dots in each diagram.
| Diagram | 1 | 2 | 3 | 4 | 5 | 6 |
| Dots | 3 | 8 | 13 |
(ii) Write down the rule for continuing the sequence of dots.
(iii) Write down an expression, in terms of n, for the number of dots in Diagram n.
(iv) Find the number of dots in Diagram 15.
(b) The dots are joined by sloping lines and horizontal lines.
(i) Diagram 1 has 2 sloping lines and Diagram 2 has 6 sloping lines.
Find the number of sloping lines in Diagrams 3 and 4.
(ii) Write down an expression, in terms of n, for the number of sloping lines in Diagram n.
▶️ Answer/Explanation
(a)(i) Ans:
| Diagram | 1 | 2 | 3 | 4 | 5 | 6 |
| Dots | 3 | 8 | 13 | 18 | 23 | 28 |
Solution: The pattern increases by 5 dots per diagram. For Diagram 4: \(13 + 5 = 18\), Diagram 5: \(18 + 5 = 23\), and Diagram 6: \(23 + 5 = 28\).
(a)(ii) Ans: Add 5 oe
Solution: Each subsequent diagram adds 5 dots to the previous count.
(a)(iii) Ans: \(5n – 2\) oe
Solution: The nth term formula is derived from the pattern: \( \text{Dots} = 5n – 2 \), since for \(n=1\), \(5(1) – 2 = 3\), and for \(n=2\), \(5(2) – 2 = 8\).
(a)(iv) Ans: 73
Solution: Substitute \(n = 15\) into the formula: \(5(15) – 2 = 75 – 2 = 73\).
(b)(i) Ans: 10 14
Solution: The pattern increases by 4 sloping lines per diagram. For Diagram 3: \(6 + 4 = 10\), and for Diagram 4: \(10 + 4 = 14\).
(b)(ii) Ans: \(4n – 2\) oe
Solution: The nth term formula is \( \text{Sloping lines} = 4n – 2 \), since for \(n=1\), \(4(1) – 2 = 2\), and for \(n=2\), \(4(2) – 2 = 6\).