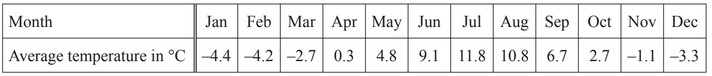
The table shows the average temperature for Tromso, Norway each month.
(a) (i) Write down the month which had the highest average temperature.
(ii) How much warmer was it in September than in February?
(iii) The lowest temperature in October was 12.3°C below the average temperature for that month.
Work out the lowest temperature in October.
(b) In a survey, some tourists were asked how they had travelled to Norway.
The pie chart shows the results.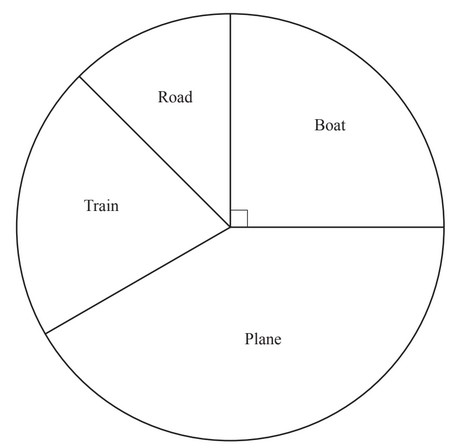
(i) 150 of these tourists travelled by boat.
Show that 600 tourists took part in the survey.
(ii) Calculate the number of these tourists who travelled by plane.
(c) A train ticket from Oslo to Stavanger costs 885 krone.
There is a discount of 12% on the total cost of the tickets for a group of 10 or more people.
Calculate the cost of tickets for a group of 15 people.
(d) On 1 January 2000, the population of Norway was 4480 000, correct to 3 significant figures.
(i) Write this number in standard form.
(ii) On 1 January 2011, the population of Norway was 4920000, correct to 3 significant figures.
Calculate the percentage increase in the population.
▶️ Answer/Explanation
(a)
(i) Ans: July or Jul (Highest temperature in the table).
(ii) Ans: 10.9°C (Difference between September (6.5°C) and February (-4.4°C)).
(iii) Ans: -9.6°C (October average (2.7°C) minus 12.3°C).
(b)
(i) Proof: Boat sector = 90° ⇒ Total tourists = \(150 \div \frac{90}{360} = 600\).
(ii) Ans: 250 (Plane sector = 150° ⇒ Tourists = \(\frac{150}{360} \times 600\)).
(c) Ans: 11682 krone
Total cost = 15 × 885 = 13275 krone.
Discount = 12% of 13275 = 1593 krone.
Final cost = 13275 – 1593 = 11682 krone.
(d)
(i) Ans: \(4.48 \times 10^6\) (Standard form of 4,480,000).
(ii) Ans: 9.82% (Increase = 4920000 – 4480000 = 440000 ⇒ Percentage = \(\frac{440000}{4480000} \times 100\)).
(a) Anton records the number of pets owned by each of 50 families. The table shows some of his results.
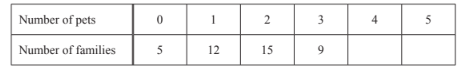
There are twice as many families with 4 pets than with 5 pets.
(i) Complete the table.
(ii) Complete the bar chart.

(iii) Write down the mode.
(iv) Calculate the mean.
(b) 80 of the pets owned by the families are cats, rabbits or hamsters. The table shows the number of each pet.
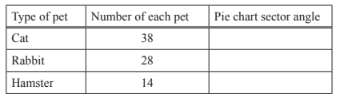
(i) Complete the table.
(ii) Complete the pie chart.

(iii) One of the pets is chosen at random. Find the probability that a rabbit is chosen.
▶️ Answer/Explanation
(a)(i) Ans: 6 families with 4 pets, 3 families with 5 pets
Total families = 50. Sum of given frequencies = 41. Remaining families = 9.
Let \( x \) = families with 5 pets ⇒ \( 2x \) = families with 4 pets.
\( 2x + x = 9 \) ⇒ \( x = 3 \). So, 6 families have 4 pets, 3 have 5 pets.
(ii) Bar heights: 6 (4 pets), 3 (5 pets).
(iii) Ans: 2 (mode = most frequent, 15 families have 2 pets).
(iv) Ans: 2.16 Mean = \( \frac{(0×5)+(1×12)+(2×15)+(3×9)+(4×6)+(5×3)}{50} = \frac{108}{50} = 2.16 \).
(b)(i) Ans: 171°, 126°, 63°
Sector angles: Cats = \( \frac{38}{80} × 360° = 171° \), Rabbits = 126°, Hamsters = 63°.
(ii) Pie chart sectors: 171° (cats), 126° (rabbits), 63° (hamsters).
(iii) Ans: \( \frac{7}{20} \) P(Rabbit) = \( \frac{28}{80} = \frac{7}{20} \).