Question
The table shows the height, in metres, above sea-level and the temperature, in °C, at midday for some
places on a mountain.
(a) Complete the scatter diagram for these results.
The fi rst four points have been plotted for you.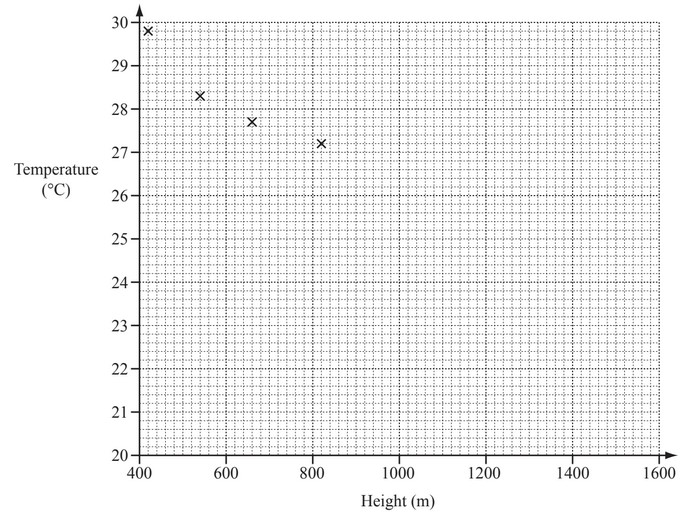
(b) What type of correlation does this scatter diagram show?
(c) On the grid, draw the line of best fit.
(d) Use your line of best fit to estimate the temperature at a height of 1400m.
Answer/Explanation
Answer:
(a) 4 points plotted correctly
(b) negative
(c) correct ruled line
(d) 22.4 – 22.8
Question
12 athletes took part in the 100 metres race.
11 of these athletes also took part in the long jump.
The times and distances, each measured correct to 3 signifi cant fi gures, for these athletes are shown in the
table.

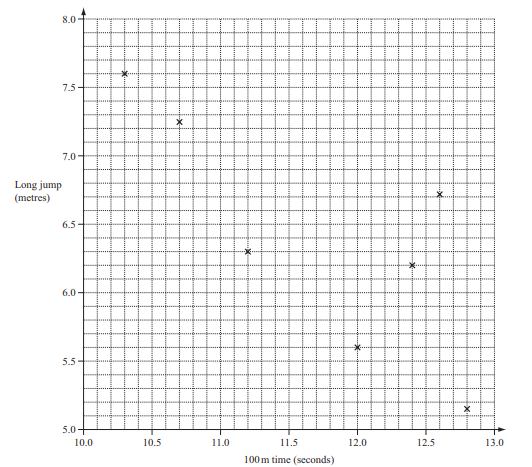
(a) The scatter diagram shows the times and distances for athletes B to H.
(i) Plot the times and distances for athletes I, J, K and L.
Answer/Explanation
Ans:
(ii) On the scatter diagram, draw a line of best fi t.
Answer/Explanation
Ans:
(iii) Athlete A did not take part in the long jump.
Use your line of best fi t to estimate a long jump distance for athlete A.
Answer/Explanation
Ans:
(iv) What type of correlation is shown on the scatter diagram?
Answer/Explanation
Ans:
(v) Describe in words the relationship between the time for 100 metres and the distance in the long jump.
Answer/Explanation
Ans:
(b) Use the table of times and distances to work out
(i) the mean of the 100 metres times,
Answer/Explanation
Ans:
(ii) the percentage of athletes who ran 100 metres in less than 11.5 seconds,
Answer/Explanation
Ans:
(iii) the range of the distances jumped by the 11 athletes, B to L.
Answer/Explanation
Ans:
Question
(a) Ten students take a physics examination and a mathematics examination.
Their scores are recorded in the table below.

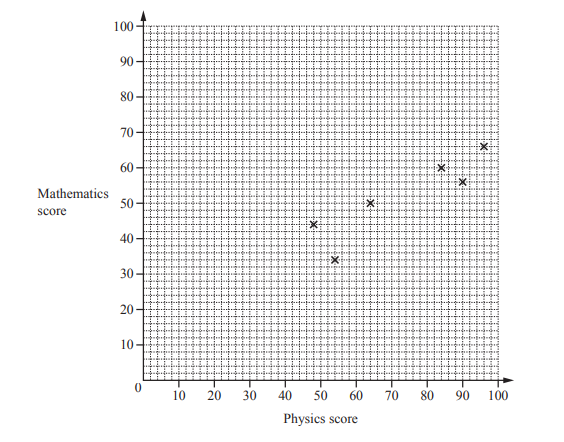
(i) Complete the scatter diagram.
The first six points have been plotted for you.
Answer/Explanation
Ans: 4 points correctly plotted
(ii) What type of correlation is shown by the scatter diagram?
Answer/Explanation
Ans: positive
(iii) On the grid, draw a line of best fit.
Answer/Explanation
Ans: correct ruled straight line
(iv) Another student scored 52 in the mathematics examination.
Use your line of best fit to estimate this student’s score in the physics examination.
Answer/Explanation
Ans: 74
(b) This graph can be used to convert between pounds (lb) and kilograms (kg).
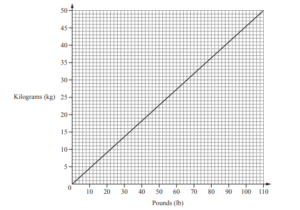
Use the graph to convert
(i) 50 pounds to kilograms,
Answer/Explanation
Ans: 22 < Ans ≤ 23
(ii) 275 kilograms to pounds.
Answer/Explanation
Ans: 590 ≤ ans ≤ 620
Question
Ten students each take two French tests.
Their marks are recorded in the table below.
(a) One of the ten students is chosen at random.
Find the probability that their mark on Test 2 is higher than their mark on Test 1.
(b) (i) Complete the scatter diagram.
The first six points have been plotted for you.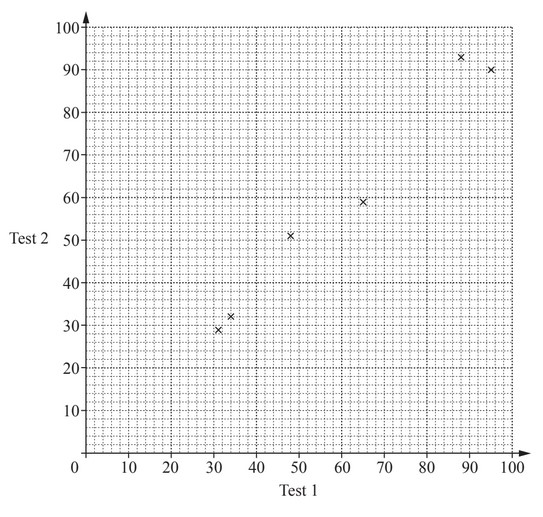
(ii) What type of correlation is shown on the scatter diagram?
(iii) On the grid, draw the line of best fit.
(iv) Another student scored 45 marks on Test 2.
Use your line of best fit to estimate the mark for this student on Test 1.
(v) A different student scored 10 marks on Test 1.
Explain why you should not use your scatter diagram to estimate their mark on Test 2.
Answer/Explanation
Ans:
(a) \(\frac{2}{10}\) oe
(b) (i) 4 points correctly plotted
(ii) positive
(iii) correct ruled line
(iv) 46 to 48
(v) 10 is not in range of recorded
test 1 results
Question
Ten students each take two French tests.
Their marks are recorded in the table below.
(a) One of the ten students is chosen at random.
Find the probability that their mark on Test 2 is higher than their mark on Test 1.
(b) (i) Complete the scatter diagram.
The first six points have been plotted for you.
(ii) What type of correlation is shown on the scatter diagram?
(iii) On the grid, draw the line of best fit.
(iv) Another student scored 45 marks on Test 2.
Use your line of best fit to estimate the mark for this student on Test 1.
(v) A different student scored 10 marks on Test 1.
Explain why you should not use your scatter diagram to estimate their mark on Test 2.
Answer/Explanation
Ans:
(a) \(\frac{2}{10}\) oe
(b) (i) 4 points correctly plotted
(ii) positive
(iii) correct ruled line
(iv) 46 to 48
(v) 10 is not in range of recorded
test 1 results
Question
(a) The scatter diagram shows the scores for each student in class A for the written test and the speaking
test in French.
A line of best fit has been drawn.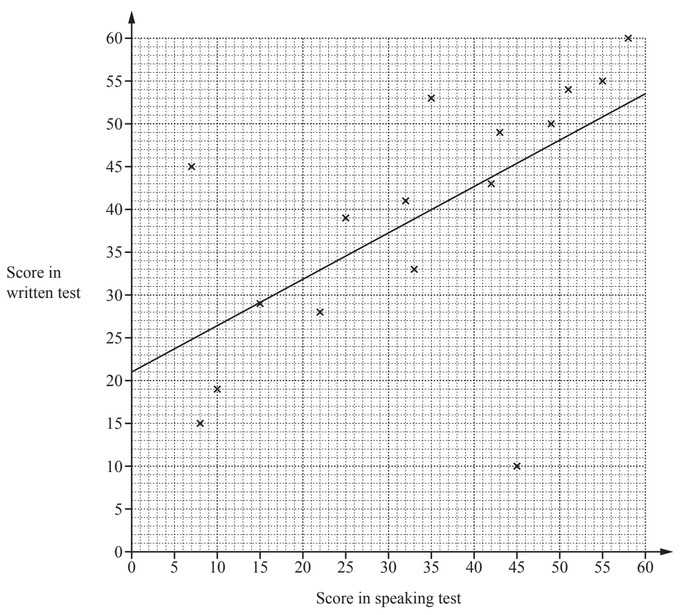
(i) Each test is marked out of 60.
In which test did the class perform better?
Give a reason for your answer.
………………………………………. because ……………………………………………………………………………..
(ii) What type of correlation is shown in the scatter diagram?
(iii) One student is much better at speaking French than writing French.
Put a ring around the cross that represents this student.
(iv) One student scored 39 in the speaking test but was absent for the written test.
Use the line of best fit to estimate a score for this student in the written test.
(b) Here are the scores in the written test for class B.
21 14 48 32 8 29 41 39 30 23 17
Find
(i) the median,
(ii) the mean.
Answer/Explanation
Ans:
(a) (i) Written test and a valid reason
(ii) Positive
(iii) (45,10) indicated
(iv) 42
(b) (i) 29
(ii) 27.5 or 27.45 to 27.46
Question
Ten students estimate the length and width of their rectangular school hall.
The results are shown in the table.
The first 8 results have been plotted on the scatter diagram.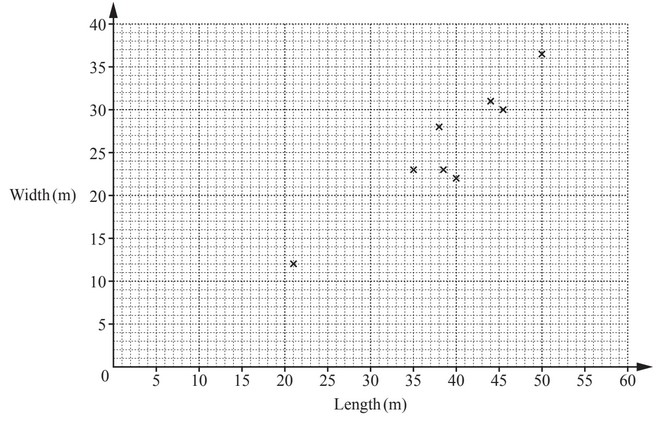
(a) On the scatter diagram, plot the results for students I and J.
(b) What type of correlation is shown by this scatter diagram?
(c) (i) On the scatter diagram, draw a line of best fit.
(ii) Another student, Pedro, estimates the length of the hall as 31m.
His result for the width is missing.
Use your line of best fit to estimate his result for the width.
……………………….. m
(d) The actual measurements of the hall are length 44m and width 34m.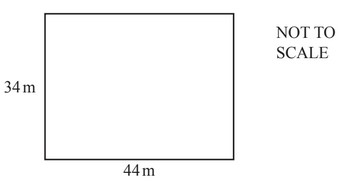
(i) The teacher says a ‘good estimator’ has both estimates no more than 5m from the actual
measurements.
Write down the letters of the students who are ‘good estimators’.
(ii) Work out the perimeter of the hall.
…………………… m
(iii) Calculate the length of a diagonal of the hall.
…………………………… m
(e) The hall is divided into two areas.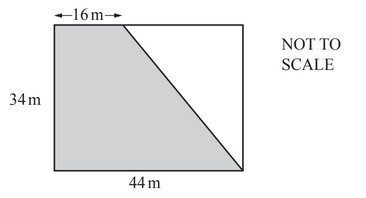
Find the shaded area.
………………………. \(m^2\)
Answer/Explanation
Answer:
(a) I, J correctly plotted
(b) positive
(c) (i) ruled line of best fit
(ii) 16 to 19
(d) (i) D,H, I
(ii) 156
(iii) 55.6 or 55.60 to 55.61
(e) 1020
Question
Lucy asked 12 people how many hours they each spent playing a computer game and the number of levels
they each completed in one month.
The results are shown in the table.

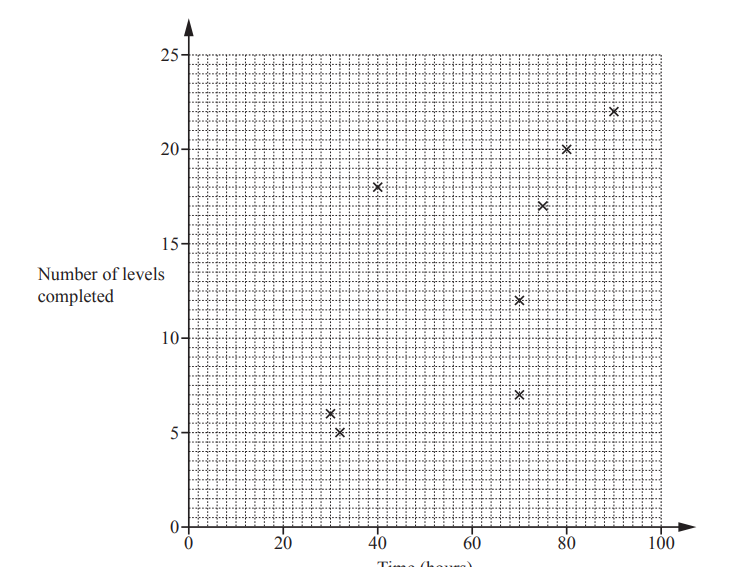
(a) Complete the scatter diagram.
The first eight points have been plotted for you.
(b) One person completes more levels per hour than any of the others.
On the scatter diagram, put a ring around the point for this person.
(c) What type of correlation does this scatter diagram show?
…………………………………………
(d) On the scatter diagram, draw a line of best fit.
(e) Another person, Monika, completed 19 levels but forgot to record the time spent playing.
Use your line of best fit to estimate the number of hours that Monika spent playing.
………………………………… hours
Answer/Explanation
(a) 4 points correctly plotted
(b) (40, 18) indicated
(c) Positive
(d) Correct ruled line
(e) 76 to 80
Question
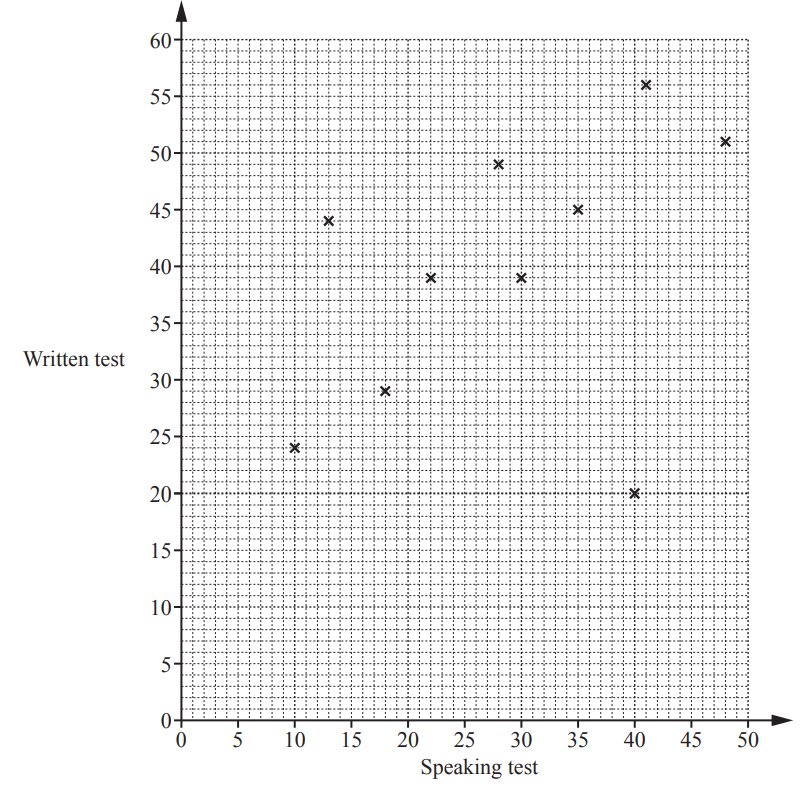
Fourteen students each take two tests in French, a speaking test and a written test.
The table shows the scores.

(a) Complete the scatter diagram.
The first ten points have been plotted for you.[2]
(b) What type of correlation is shown in this scatter diagram?[1]
(c) One student has a high score in the speaking test and a low score in the written test.
On the scatter diagram, put a ring around this point. [1]
(d) On the scatter diagram, draw a line of best fit. [1]
(e) Use your line of best fit to estimate a score in the written test for a student who scored 25 in the speaking test.[1]
Answer/Explanation
Ans:
6(a) 4 points correctly plotted
6(b) Positive
6(c) (40, 20) indicated
6(d) Ruled line of best fit
6(e) 33 to 42
Question
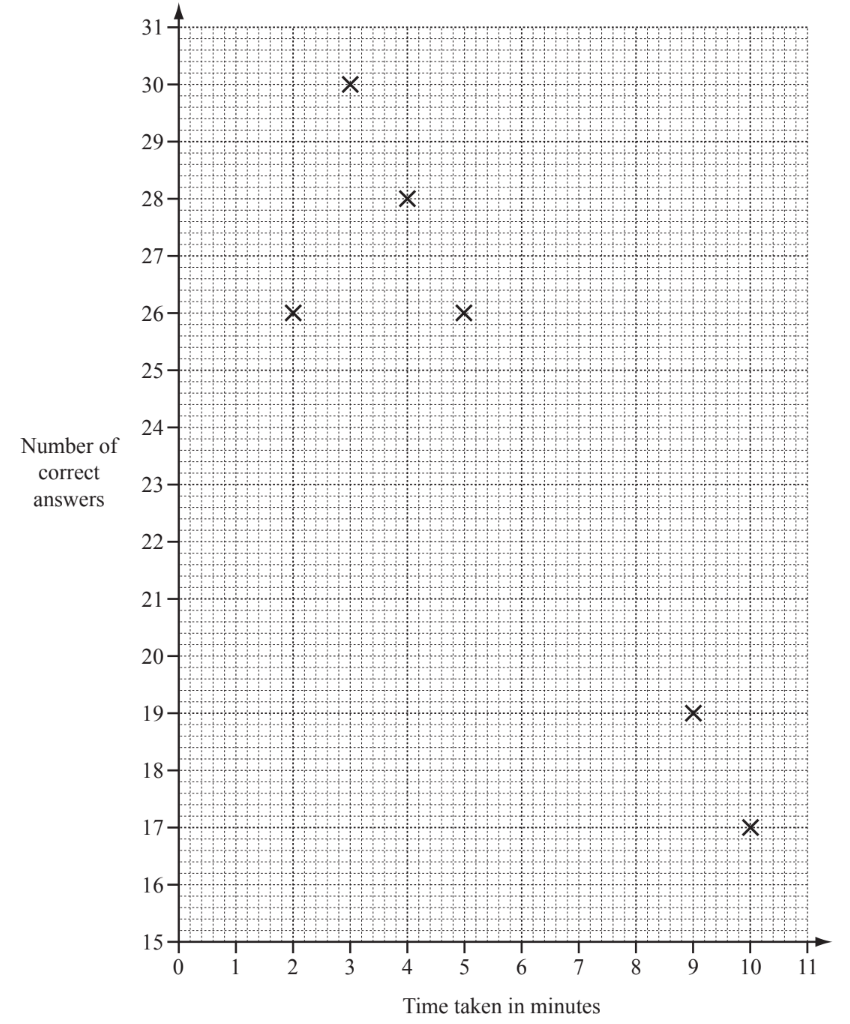
Twelve students each answer 30 questions in a quiz.
The time taken and the number of correct answers for each student is given in the table.

(a) Complete the scatter diagram below to show this information. The first six points have been plotted for you.
(b) What type of correlation does the scatter diagram show?
(c) (i) Find the range of the time taken.
(ii) Calculate the mean time taken.
(d) (i) Find the mode for the number of correct answers.
(ii) Find the median for the number of correct answers.
(e) One of the 12 students is selected at random. Write down the probability that the student
(i) took more than 8 minutes to answer the quiz,
(ii) took less than 5 minutes and had more than 24 correct answers.
▶️Answer/Explanation
(a) 6 points correctly plotted
(b) negative cao
(c) (i) $8 \mathrm{cao}$
(ii) $\operatorname{art} 5.92$
(d) (i) $26 \mathrm{cao}$
(ii) 23.5 cao
(e) (i) $\frac{2}{12}$ oe
(ii) $\frac{3}{12}$ oe
Question
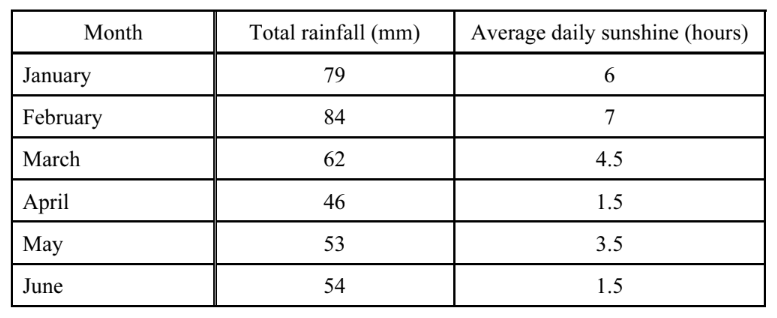
The table shows some data about rainfall and sunshine.
(a) For the rainfall, calculate
(i) the mean,
(ii) the range.
(b) For the sunshine, find
(i) the mode,
(ii) the median.
(c) Dinesh draws a pie chart to display the rainfall data. Calculate the sector angle for February.
(d) Amalia draws a pictogram to display the sunshine data for January and February.

(i) Complete the key for the pictogram.
(ii) Complete the pictogram for March.
(e) Priya draws a scatter diagram to find the correlation between rainfall and sunshine for January to June.
(i) Complete the scatter diagram below. January and February are plotted for you.
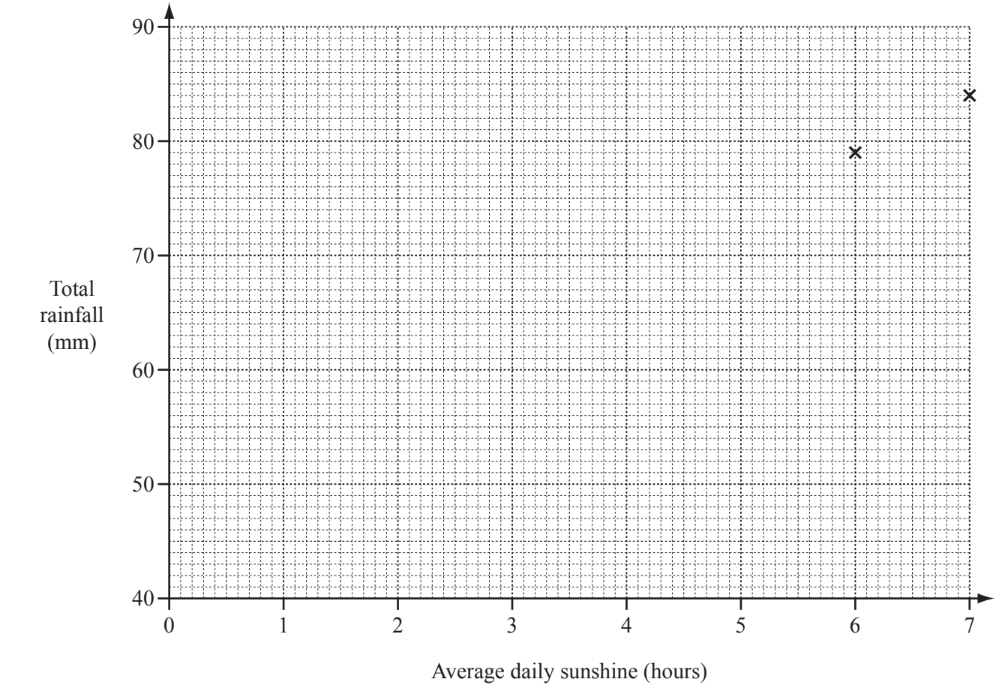
(ii) What type of correlation does the scatter diagram show?
▶️Answer/Explanation
(a) (i) 63
(ii) 38 cao
(b) (i) $1.5 \mathrm{cao}$
(ii) 4
(c) $80^{\circ}$
(d) (i) 1 hour
(ii) 4 and a half more suns drawn
(e) (i) 4 correct plots
(ii) Positive
Question
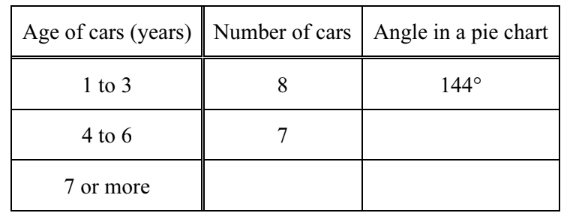
The table below shows the age and price of 20 used cars in a showroom.

(a) Use this information to complete the following table.
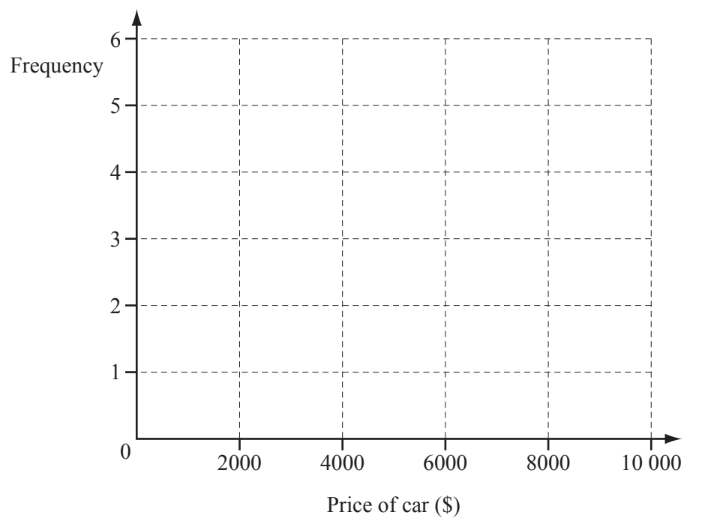
(b) (i) Complete the frequency table for the price, $x, of the cars.

(ii) Draw a histogram to show this information.
(c) (i) On the grid below complete the scatter diagram showing the age and price of each car.
The first 10 points from the original table have been plotted.
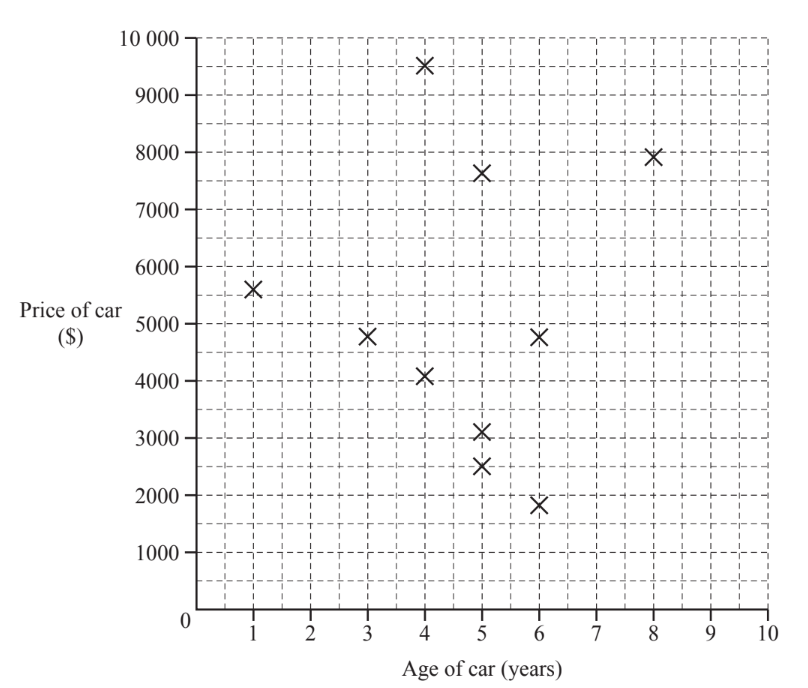
(ii) What correlation is there between the price of a car and its age?
(iii) A car is chosen at random. Using your scatter diagram, find the probability that the car is more than 4 years old and the price is more than $5000.
▶️Answer/Explanation
(a) 5 , $126, \quad 90$
(b) (i) $3,5,6,4,2$
(ii) Blocks ‘correct’ heights No gaps.
(c) (i) 10 points plotted correctly
(ii) Zero oe
(iii) $\frac{3}{20}$ oe or 0.15 or $15 \%$
