Question
Mrs Salaman gives her class two mathematics tests.
The scatter diagram shows information about the marks each student scored.
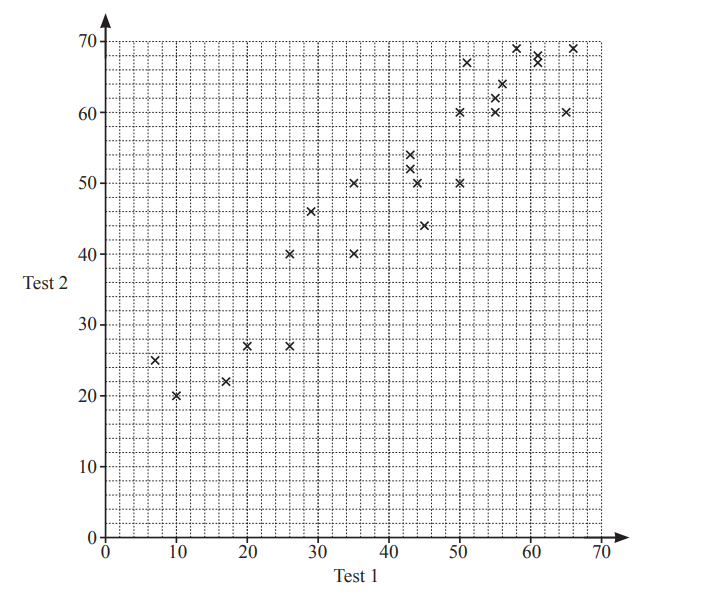
(a) Write down the highest mark scored on test 1.
………………………………………….
(b) Write down the type of correlation shown in the scatter diagram.
………………………………………….
(c) Draw a line of best fit on the scatter diagram.
(d) Hamish scored a mark of 40 on test 1.
He was absent for test 2.
Use your line of best fit to find an estimate for his mark on test 2.
………………………………………….
Answer/Explanation
(a) 66
(b) Positive
(c) Ruled line of best fit
(d) 46 to 50
Question
A teacher gives her Spanish students a test each week.
Some of the students’ marks for two weeks are shown in the scatter diagram.
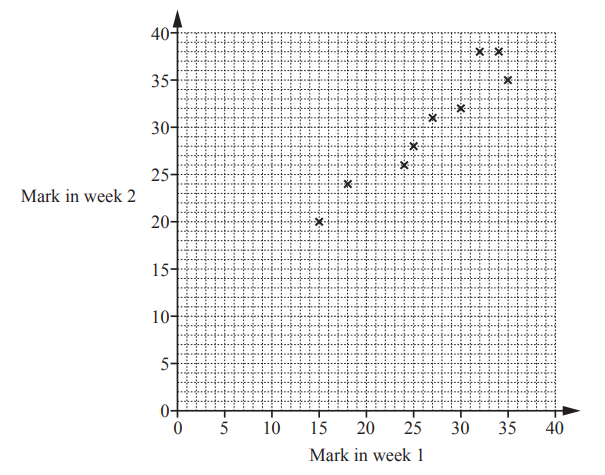
(a) Leo scored 28 marks in week 1 and 30 marks in week 2.
On the scatter diagram, plot a point to show Leo’s marks.
(b) On the scatter diagram, draw a line of best fit.
(c) Sonia scored 20 marks in week 1 but was absent in week 2.
Use your line of best fit to estimate a mark for Sonia in week 2
Answer/Explanation
(a)Point (28 , 30) marked
(b)Ruled line of best fit
(c)22 to 26
Question
The scatter diagram shows the prices of houses for sale and their distances from the city centre.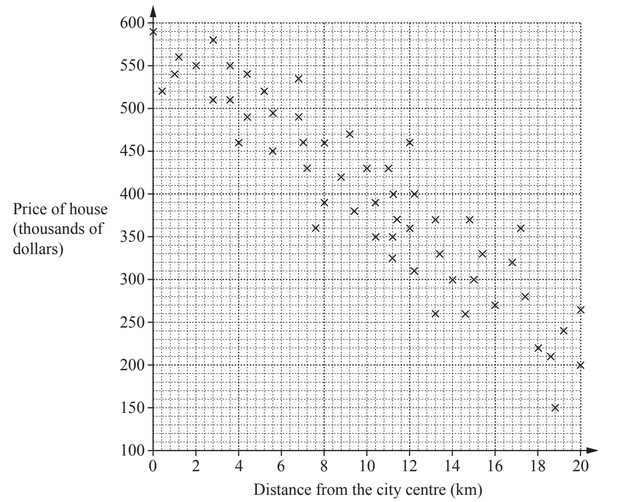
(a) What type of correlation is shown in this scatter diagram?
(b) Brad wants to live as close to the city centre as possible.
He has a maximum of $500000 to spend on one of these houses.
How close to the city centre can he live?
…………………. km
(c) (i) Draw a line of best fit on the scatter diagram.
(ii) Estimate the price of a house that is 14km from the city centre.
$ ……………………………………………
Answer/Explanation
Ans:
(a) Negative
(b) 4
(c) (i) Ruled line of best fir
(ii) 250 000 to 380 000
Question
Amir looks at adverts for the same model of car.
The scatter diagram shows the age and price of each car.
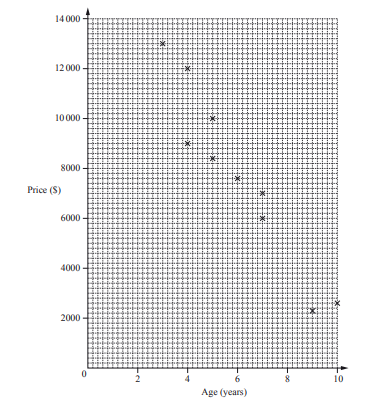
(a) What type of correlation is shown on the scatter diagram?
Answer/Explanation
Ans: Negative
(b) Draw a line of best fit on the scatter diagram.
Answer/Explanation
Ans: Single ruled line of best fit
(c) Use your line of best fit to estimate the price of a car that is 8 years old.
Answer/Explanation
Ans: $ 4000 to 5100