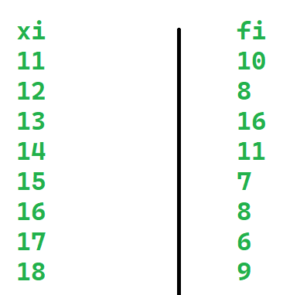
The table below shows the marks scored by a group of students in a test.
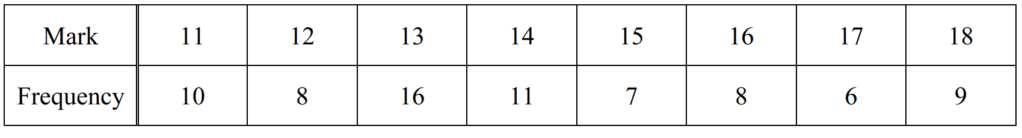
(a) Find the mean, median and mode.
(b) The table below shows the time (t minutes) taken by the students to complete the test.
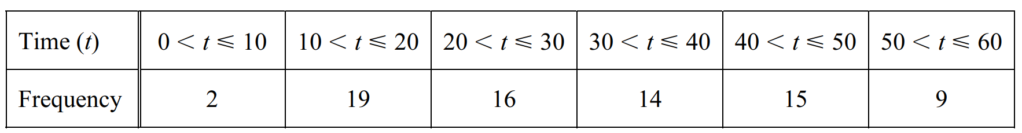
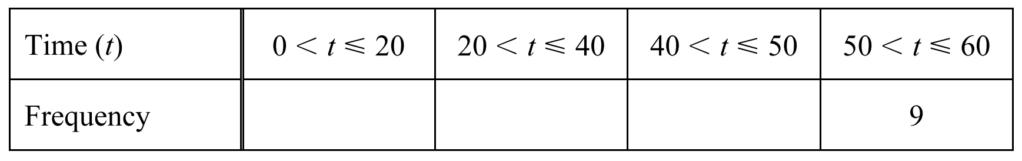
(i) Cara rearranges this information into a new table.
Complete her table.
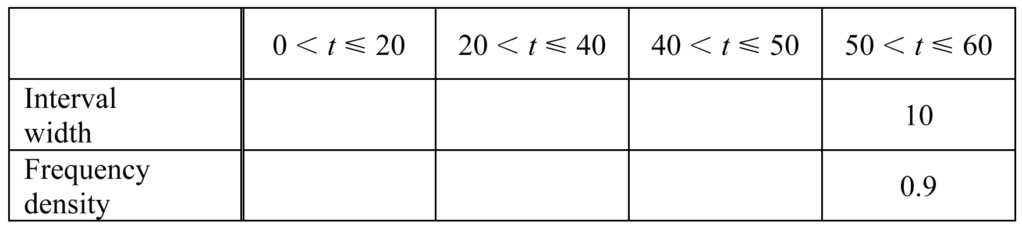
(ii) Cara wants to draw a histogram to show the information in part (b)(i).
Complete the table below to show the interval widths and the frequency densities.
(c) Some of the students were asked how much time they spent revising for the test.
10 students revised for 2.5 hours, 12 students revised for 3 hours and n students revised for 4 hours.
The mean time that these students spent revising was 3.1 hours.
Find n.
Show all your working.
▶️ Answer/Explanation
(a) Ans: Mean = 14.28, Median = 14, Mode = 16
Mean: Sum of all marks (\(\sum x_i f_i = 1071\)) divided by total students (\(\sum f_i = 75\)).
Median: The 38th student falls in the 14-mark group (cumulative frequency up to 14 is 42).
Mode: The highest frequency (16) corresponds to the mark 16.
(b)(i) Complete the grouped frequency table by summing frequencies for each new interval.
(b)(ii) Interval width = upper bound – lower bound. Frequency density = frequency ÷ interval width.
(c) Ans: n = 8
Total revision time = \(10 \times 2.5 + 12 \times 3 + n \times 4 = 61 + 4n\).
Mean = \(\frac{61 + 4n}{22 + n} = 3.1\). Solve for \(n\): \(61 + 4n = 68.2 + 3.1n \implies 0.9n = 7.2 \implies n = 8\).
Mr Chang hires x large coaches and y small coaches to take 300 students on a school trip.
Large coaches can carry 50 students and small coaches 30 students.
There is a maximum of 5 large coaches.
(a) Explain clearly how the following two inequalities satisfy these conditions.
(i) \( x \leq 5 \)
(ii) \(5x + 3y \geq 300\)
Mr Chang also knows that \(x + y \leq 10\)
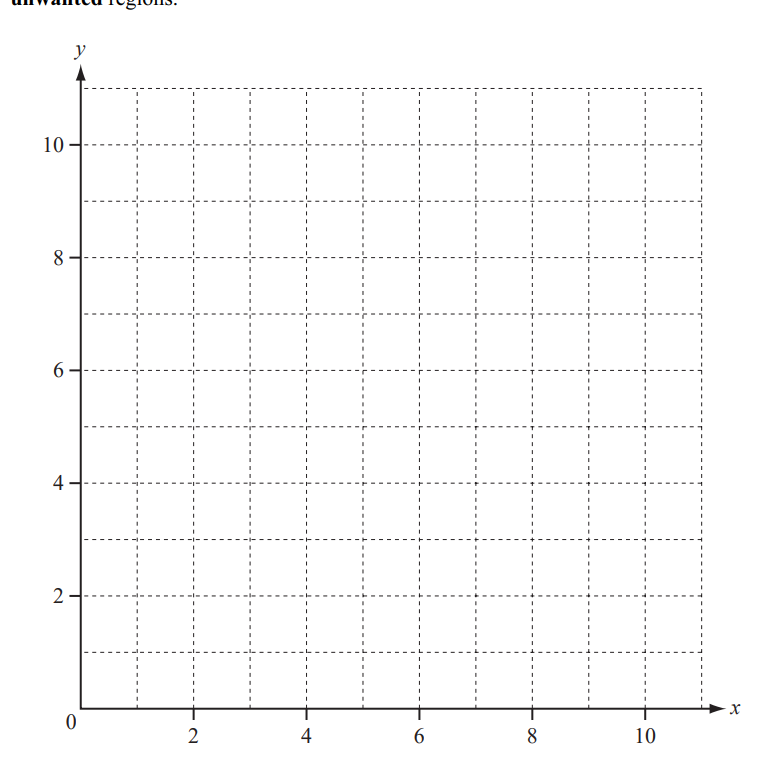
(b) On the grid, show the information above by drawing three straight lines and shading the
unwanted regions.
(c) A large coach costs \$450 to hire and a small coach costs \$350
(i) Find the number of large coaches and the number of small coaches that would give the
minimum hire cost for this school trip.
(ii) Calculate this minimum cost.
▶️ Answer/Explanation
(a)
(i) The inequality \(x \leq 5\) ensures that no more than 5 large coaches are hired, as stated in the problem.
(ii) The inequality \(5x + 3y \geq 300\) comes from the seating capacity: \(50x + 30y \geq 300\) (simplified by dividing by 10). This ensures the total seats cover all 300 students.
(b)
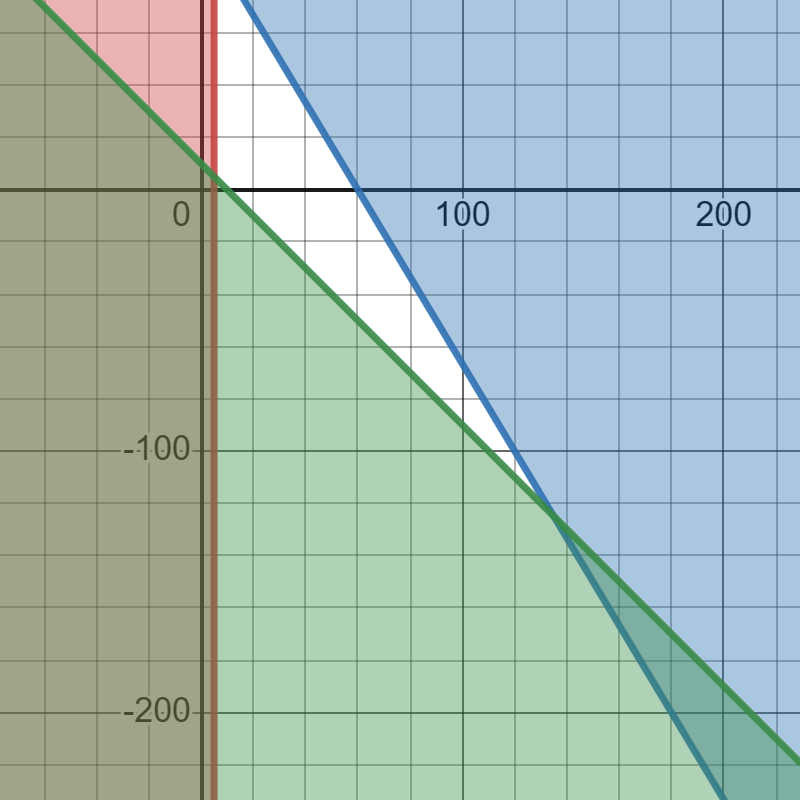
Blue shade: \(5x + 3y \geq 300\)
Green shade: \(x + y \leq 10\)
Red shade: \(x \leq 5\)
(c)(i) Ans: 5 large coaches and 5 small coaches
To minimize cost, evaluate feasible points \((x, y)\) from the graph. The optimal combination is \(x = 5\) and \(y = 5\), satisfying all constraints and minimizing \(450x + 350y\).
(ii) Ans: \$4000
Minimum cost = \(450 \times 5 + 350 \times 5 = 2250 + 1750 = \$4000\).