As the temperature increases, the number of people who go swimming increases.
Write down the type of correlation that this statement describes.
▶️ Answer/Explanation
Ans: Positive
This statement describes a positive correlation.
In a positive correlation:
- As one variable (temperature) increases, the other variable (number of swimmers) also increases.
- Both variables move in the same direction.
This is different from:
- Negative correlation: Where one variable increases while the other decreases.
- No correlation: Where there is no apparent relationship between the variables.
Six students revise for a test.
The scatter diagram shows the time, in hours, each student spent revising and their mark in the test.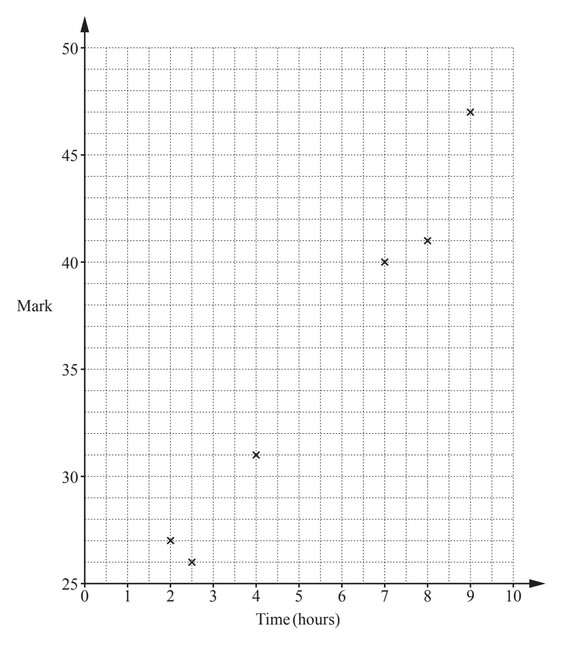
(a) The data for two more students is shown in the table.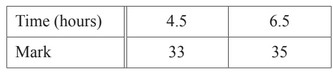
Plot these two points on the scatter diagram.
(b) What type of correlation is shown on the scatter diagram?
(c) Draw a line of best fit on the scatter diagram.
(d) Another student spent 5.5 hours revising.
Estimate a mark for this student.
▶️ Answer/Explanation
(a) Ans: Points plotted at (4.5, 33) and (6.5, 35)
From the table, plot the points where revision time is 4.5 hours (mark=33) and 6.5 hours (mark=35).
(b) Ans: Positive correlation
As revision time increases, test marks generally increase, showing a positive trend.
(c) Ans: Correct ruled line
Draw a straight line that passes through the middle of the data points, balancing those above and below.
(d) Ans: 33.5 to 37.5
Using the line of best fit, a student who revises for 5.5 hours would likely score between 33.5 and 37.5 marks.