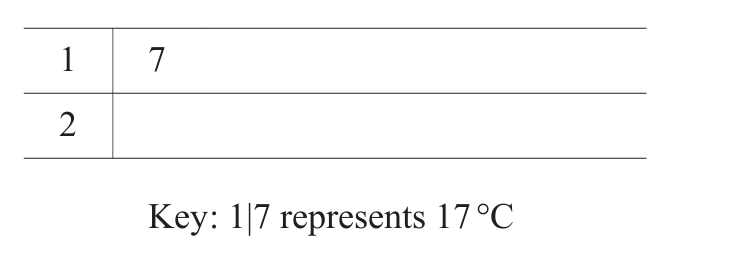
(a) The list shows 15 midday temperatures, in degrees Celsius, in Suntown.
17 21 21 18 23 22 25 19
21 17 19 18 21 24 23
(i) Complete the stem-and-leaf diagram to show this information.
(ii) Find the median.
(iii) Find the upper quartile.
(iv) Rahul draws a pie chart to show this information. Calculate the sector angle for the number of days the temperature is 18°C.
(b) 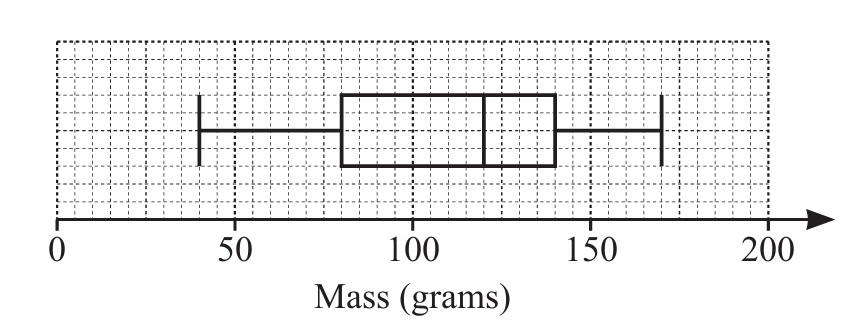
The box-and-whisker plot shows information about the masses, in grams, of some apples.
(i) Find the median.
(ii) Find the range.
(iii) Find the interquartile range.
(c) (i) The time, t minutes, spent on homework in one week by each of 200 students is recorded. The table shows the results.
| Time (t minutes) | 40 < t ≤ 60 | 60 < t ≤ 80 | 80 < t ≤ 90 | 90 < t ≤ 100 | 100 < t ≤ 150 |
|---|---|---|---|---|---|
| Frequency | 6 | 10 | 70 | 84 | 30 |
Calculate an estimate of the mean.
(ii) A new table with different class intervals is completed.
| Time (t minutes) | 40 < t ≤ 90 | 90 < t ≤ 150 |
|---|---|---|
| Frequency | 86 | 114 |
On a histogram the height of the bar for the 40 < t ≤ 90 interval is 17.2 cm.
Calculate the height of the bar for the 90 < t ≤ 150 interval.
▶️ Answer/Explanation
(a)(i) 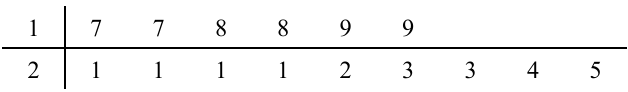
Stem-and-leaf diagram shows all temperatures sorted with stems (tens) and leaves (units).
(a)(ii) 21°C
Median is the 8th value when data is ordered: 17,17,18,18,19,19,21,21,21,21,22,23,23,24,25.
(a)(iii) 23°C
Upper quartile is median of upper half (values 9-15): 21,22,23,23,24,25 → median is 23.
(a)(iv) 48°
18°C occurs 2 days. Sector angle = (2/15) × 360° = 48°.
(b)(i) 120 g
Median is the middle line in the box plot.
(b)(ii) 130 g
Range = maximum (200) – minimum (70) = 130 g.
(b)(iii) 60 g
IQR = upper quartile (150) – lower quartile (90) = 60 g.
(c)(i) 93.4 min
Mean ≈ (50×6 + 70×10 + 85×70 + 95×84 + 125×30)/200 = 18680/200 = 93.4 min.
(c)(ii) 19 cm
Frequency density ratio is (114/60) ÷ (86/50) ≈ 1.1047. Height = 17.2 × 1.1047 ≈ 19 cm.
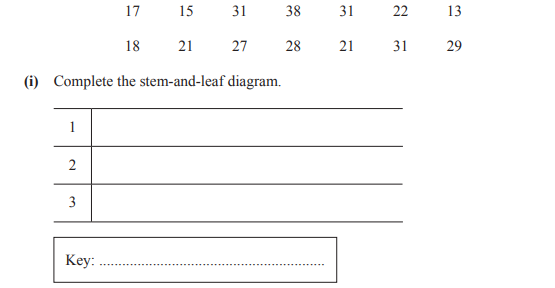
(a) Anna records the number of text messages she receives for 14 days:
(i) Find the median.
(ii) Find the mode.
(iii) Find the range.
(b) In a shop, there are 4 red and 8 grey phones. Anna and Pete each pick one of these phones at random. Work out the probability that they both pick a grey phone.
▶️ Answer/Explanation
(a)(i) Stem-and-leaf diagram with correct values
Organize the data in a stem-and-leaf plot to visualize the distribution of text messages.
(a)(ii) 24.5
Median is the average of the 7th and 8th values in the ordered data set.
(a)(iii) 31
Mode is the most frequent number in the data set.
(a)(iv) 25
Range is the difference between the highest and lowest values (31 – 6 = 25).
(b) 14/33
Probability Anna picks grey: 8/12. Probability Pete picks grey after Anna: 7/11. Combined probability: (8/12) × (7/11) = 56/132 = 14/33.