▶️ Answer/Explanation
Answer:
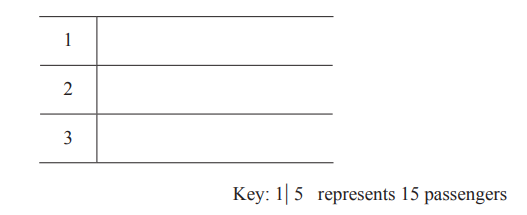
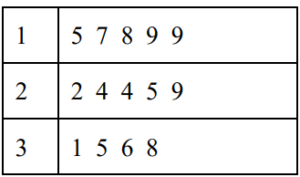
(a)
(b) 24
(a)
(b) 24
Explanation: (a) Organize data by tens (stems) and units (leaves). (b) Median is the middle value (7th and 8th terms averaged) in the ordered list: 15,17,18,19,19,22,24,24,25,29,31,35,36,38 → (24+24)/2 = 24.
