(a) 100 students each record the time, t minutes, taken to eat a pizza.
The cumulative frequency diagram shows the results.
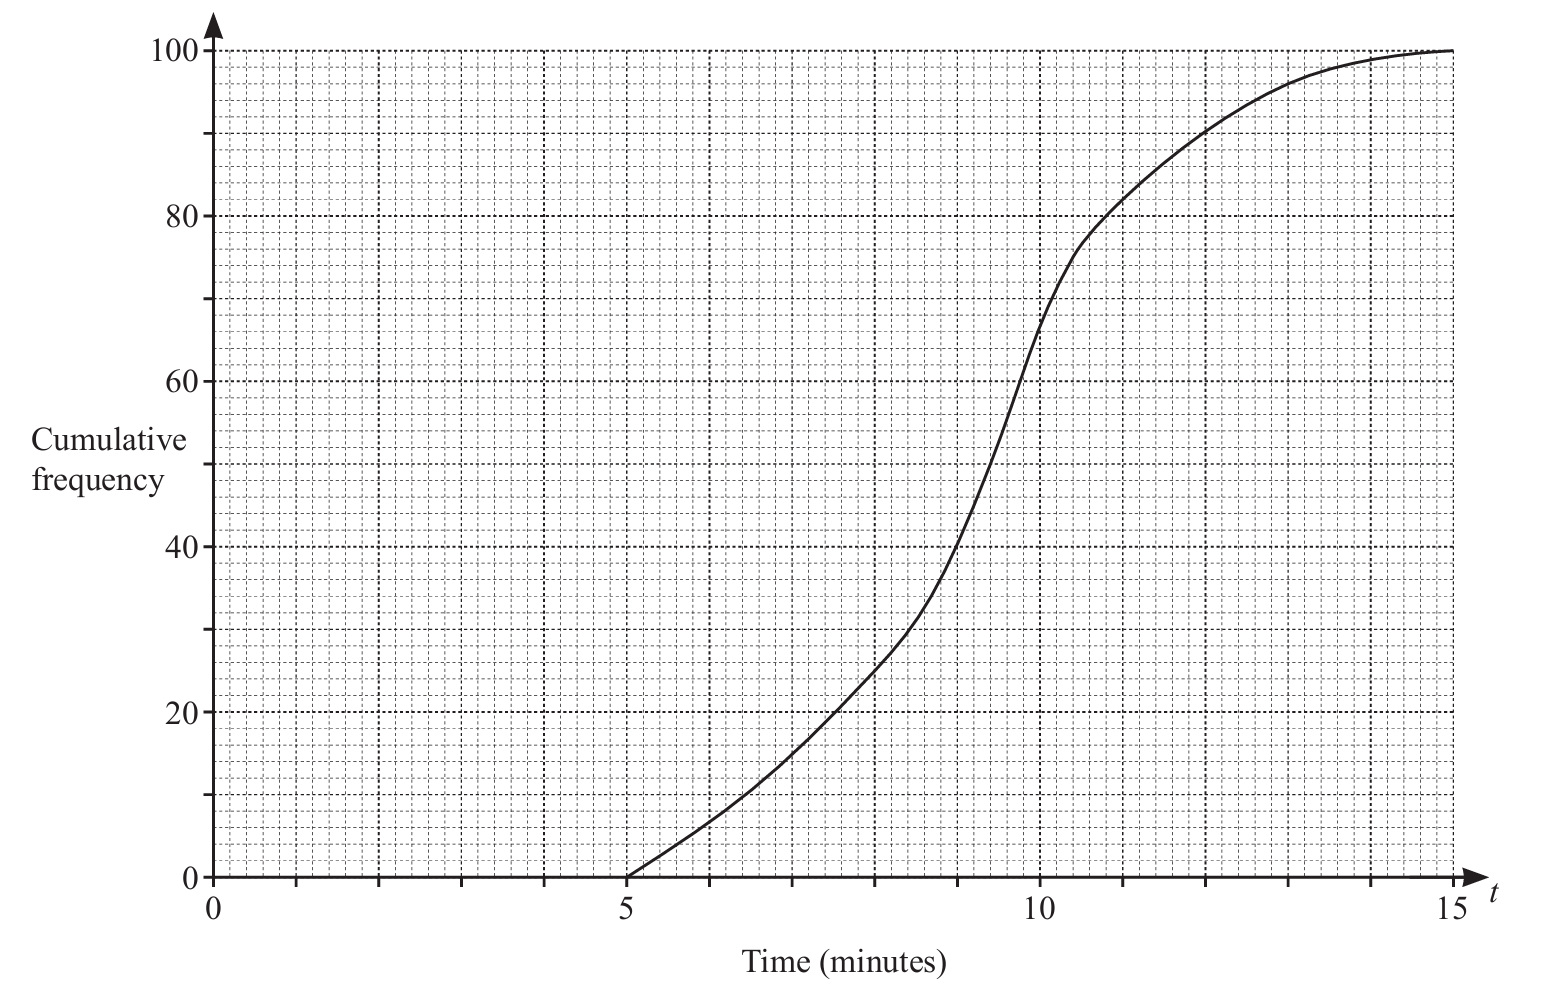
Find an estimate of
(i) the median,
(ii) the interquartile range,
(iii) the number of students taking more than 11 minutes to eat a pizza.
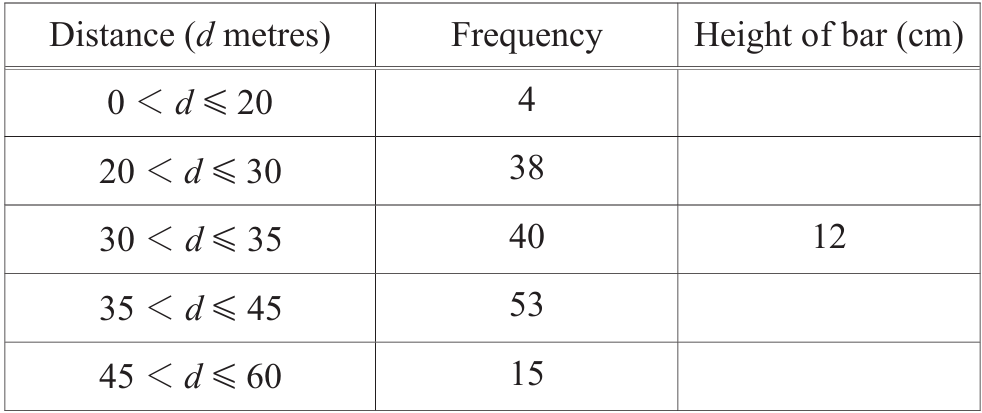
(b) 150 students each record how far they can throw a tennis ball.
The table shows the results.
| Distance (d metres) | 0 < d ≤ 20 | 20 < d ≤ 30 | 30 < d ≤ 35 | 35 < d ≤ 45 | 45 < d ≤ 60 |
|---|---|---|---|---|---|
| Frequency | 4 | 38 | 40 | 53 | 15 |
(i) Calculate an estimate of the mean.
(ii) A histogram is drawn to show this information.
The height of the bar representing 30 < d ≤ 35 is 12 cm.
Calculate the height of each of the other bars.
(iii) Two students are chosen at random.
Find the probability that they both threw the ball more than 45 m.
▶️ Answer/Explanation
(a)(i) 9.4 minutes
The median is the 50th percentile. From the cumulative frequency diagram, this corresponds to 9.4 minutes.
(a)(ii) 2.4 minutes
Interquartile range = Upper quartile (10.4 minutes) – Lower quartile (8 minutes) = 2.4 minutes.
(a)(iii) 18 students
100 – 82 = 18 students took more than 11 minutes (82 students took ≤11 minutes).
(b)(i) 34.65 metres
Using midpoints: (10×4 + 25×38 + 32.5×40 + 40×53 + 52.5×15) ÷ 150 = 5197.5 ÷ 150 = 34.65 m.
(b)(ii) Heights: 0.3 cm, 5.7 cm, 12 cm, 7.95 cm, 1.5 cm
Frequency density = frequency ÷ class width. For 30-35m: 40÷5 = 8 units/cm. Scaling factor = 12÷8 = 1.5. Other heights: frequency density × 1.5.
(b)(iii) 7/745
Probability = (15/150) × (14/149) = 7/745 ≈ 0.0094 or 0.94% chance both threw >45m.
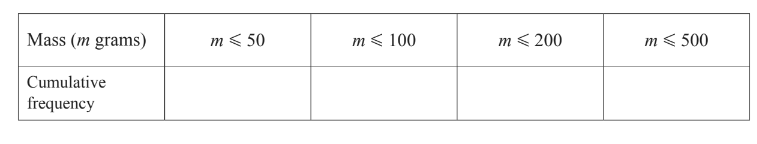
The table shows information about the mass, m grams, of each of 120 letters.

(b) Iraj draws a histogram to show this information.
He makes the height of the first bar 17.2cm.
Calculate the height of each of the remaining bars.
(c) Complete the cumulative frequency table.
(d) Draw a cumulative frequency diagram.

(e) Use the cumulative frequency diagram to find an estimate for
(i) the median,
(ii) the upper quartile,
(iii) the 40th percentile,
(iv) the number of letters with a mass m where
▶️ Answer/Explanation
(a) 121 or 120.8… or 120 \(\frac{5}{6}\)
Total letters = 120. Sum of frequencies = 120 → Calculation confirms consistency.
(b) 12.4, 5, 1.4
Height of bars is proportional to frequency density (frequency ÷ class width). First bar height = 17.2 cm → Others calculated proportionally.
(c) 43, 74, 99, 120
Cumulative frequency is the running total of frequencies: 0-20 → 43, 0-40 → 74, etc.
(d) Correct diagram
Plot cumulative frequencies against upper class boundaries and join points smoothly.
(e)(i) Median ≈ 30-40g (depends on diagram)
Median is at 50% of 120 = 60th value → Read mass from diagram.
(e)(ii) Upper quartile ≈ 40-50g (depends on diagram)
Upper quartile is at 75% of 120 = 90th value → Read mass from diagram.
(e)(iii) 40th percentile ≈ 20-30g (depends on diagram)
40th percentile is at 40% of 120 = 48th value → Read mass from diagram.
(e)(iv) Number of letters ≈ 30 (depends on diagram)
Subtract cumulative frequency at lower bound (e.g., 250g) from upper bound (e.g., 400g).