Indira records the time taken for workers in her company to travel to work.
The table and the histogram each show part of this information.
| Time (t minutes) | 0 < t ≤ 10 | 10 < t ≤ 25 | 25 < t ≤ 40 | 40 < t ≤ 60 | 60 < t ≤ 80 |
|---|---|---|---|---|---|
| Frequency | 57 | 38 | 12 |
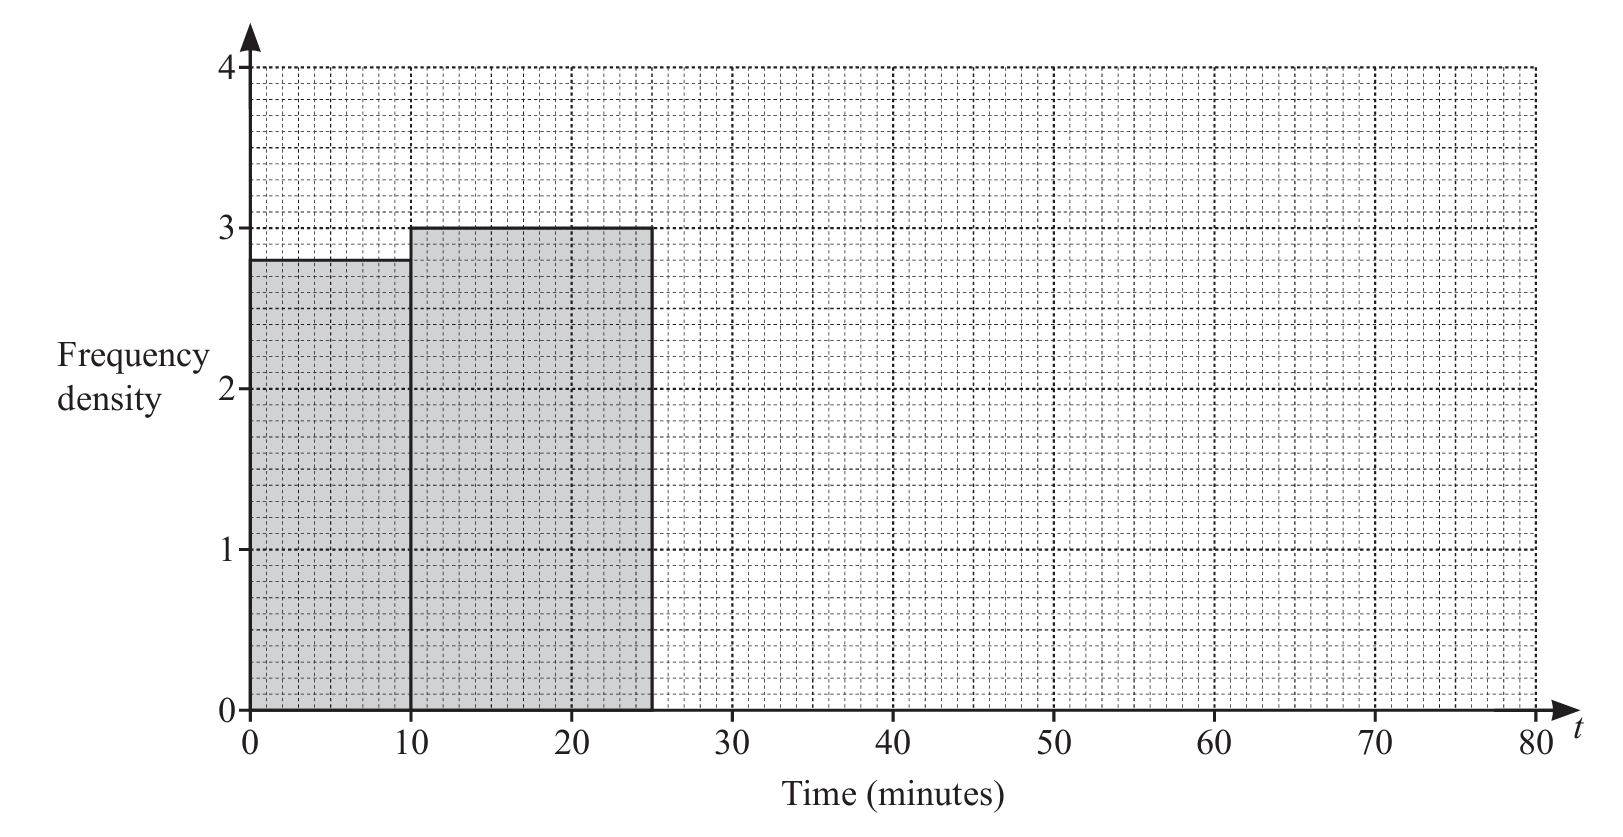
(a) Complete the table and the histogram.
(b) Calculate an estimate of the mean time.
(c) Rashid says:
‘The longest time that any of these workers take to travel to work is 80 minutes.’
Give a reason why Rashid may be wrong.
(d) Indira picks three workers at random from those who take longer than 25 minutes to travel to work.
Calculate the probability that one worker takes 60 minutes or less and the other two each take more than 60 minutes.
▶️ Answer/Explanation
(a) Table: 28 and 45 for first two intervals. Histogram: Bars completed with correct heights.
For the table, calculate frequencies using histogram area principles. For the histogram, ensure bar heights match frequency densities.
(b) 30.7 minutes
Calculate midpoints (5, 17.5, 32.5, 50, 70). Multiply by frequencies and sum (28×5 + 45×17.5 + 57×32.5 + 38×50 + 12×70). Divide by total frequency (180).
(c) The data is grouped, so exact values are unknown.
Since we only know the range (60-80 minutes), some workers might take slightly more than 80 minutes but are still recorded in this group.
(d) 1254/39697 (≈0.0316)
Total workers >25min = 107 (57+38+12). Probability = (95/107)×(12/106)×(11/105)×3, where 95 = workers ≤60min (57+38). The multiplication by 3 accounts for different orderings.
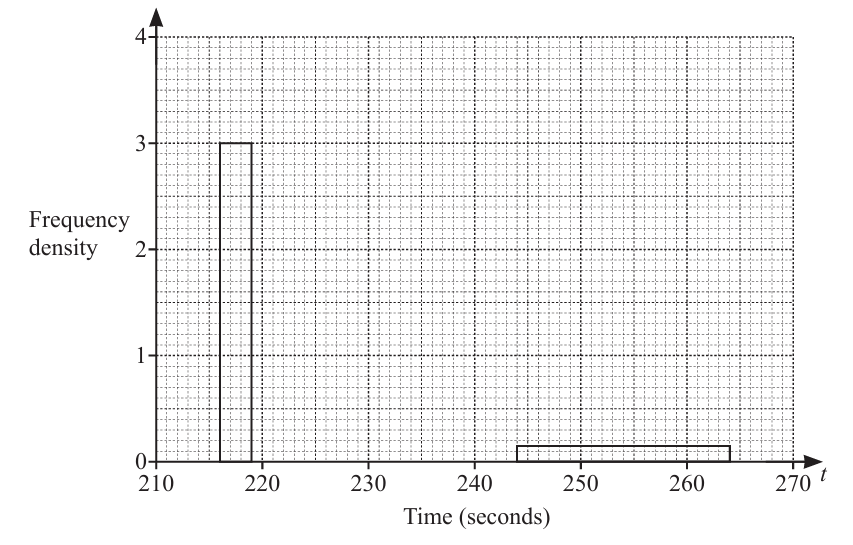
The frequency table shows the time of each of 42 athletes in a race.
| Time (t seconds) | Number of athletes |
|---|---|
| 216 < t ≤ 219 | 9 |
| 219 < t ≤ 224 | 14 |
| 224 < t ≤ 234 | 14 |
| 234 < t ≤ 244 | 2 |
| 244 < t ≤ 264 | 3 |
(a) Calculate an estimate of the mean time.
(b) Complete the histogram to show the information in the frequency table.
Two of the blocks have been drawn for you.
▶️ Answer/Explanation
(a) 226 seconds
First find midpoints: (216+219)/2=217.5, (219+224)/2=221.5, etc. Multiply each by frequency: 217.5×9=1957.5, 221.5×14=3101, etc.
Sum all products (1957.5+3101+…)=9499.5. Divide by total athletes (42) to get mean: 9499.5÷42≈226.2 seconds.
(b) Histogram completion
Calculate frequency densities: 9/3=3, 14/5=2.8, 14/10=1.4, 2/10=0.2, 3/20=0.15. Draw blocks with these heights for respective intervals.
The 219-224s block should be 2.8 units high, 224-234s block 1.4 units, and 234-244s block 0.2 units high.