The heights, \( h \) metres, of the 120 boys in an athletics club are recorded.
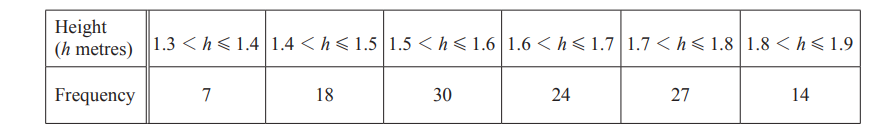
The table shows information about the heights of the boys.
(a) (i) Write down the modal class.
(ii) Calculate an estimate of the mean height.
(b) (i) One boy is chosen at random from the club.
Find the probability that this boy has a height greater than 1.8m.
(ii) Three boys are chosen at random from the club.
Calculate the probability that one of the boys has a height greater than 1.8m and the other two boys each have a height of 1.4m or less.
(c) (i) Use the frequency table on page 4 to complete the cumulative frequency table.

(ii) On the grid, draw a cumulative frequency diagram to show this information.

(d) Use your diagram to find an estimate for
(i) the median height,
(ii) the 40th percentile.
▶️ Answer/Explanation
(a)(i) Ans: \( 1.5 < h \leq 1.6 \)
The modal class is the interval with the highest frequency, which is \( 1.5 < h \leq 1.6 \) (frequency = 24).
(a)(ii) Ans: 1.62 or 1.623…
Midpoints: 1.35, 1.45, 1.55, 1.65, 1.75, 1.85. Multiply by frequencies: 40.5, 58, 37.2, 49.5, 24.5, 25.9. Sum (235.6) divided by 120 gives 1.623.
(b)(i) Ans: \( \frac{14}{120} \)
Number of boys with \( h > 1.8 \)m is 14. Probability = \( \frac{14}{120} \).
(b)(ii) Ans: \( \frac{21}{20060} \)
Combination of 1 boy > 1.8m and 2 boys ≤ 1.4m: \( \binom{14}{1} \times \binom{12}{2} = 14 \times 66 = 924 \). Total combinations \( \binom{120}{3} = 280840 \). Probability = \( \frac{924}{280840} = \frac{21}{20060} \).
(c)(i) Ans: 55, 79, 106, 120
Cumulative frequencies are calculated by adding previous frequencies: 55 (12+43), 79 (55+24), 106 (79+27), 120 (106+14).
(d)(i) Ans: 1.62 to 1.63
Median is at 60th percentile. From the cumulative frequency diagram, estimate ≈ 1.62-1.63m.
(d)(ii) Ans: 1.57 to 1.58
40th percentile corresponds to 48th value. From the diagram, estimate ≈ 1.57-1.58m.
(a)

The box-and-whisker plots show the times spent exercising in one week by a group of women and a group of men. Below are two statements comparing these times. For each one, write down whether you agree or disagree, giving a reason for your answer.

(b) The frequency table shows the times, t minutes, each of 100 children spent exercising in one week.

(i) Calculate an estimate of the mean time.
(ii) The information in the frequency table is shown in this cumulative frequency diagram.

Use the cumulative frequency diagram to find an estimate of
(a) the 60th percentile,
(b) the number of children who spent more than 3 hours exercising.
(iii) A histogram is drawn to show the information in the frequency table.
The height of the bar for the interval \(60 < t \leq 100\) is 10.8 cm.
Calculate the height of the bar for the interval \(160 < t \leq 220\).
▶️ Answer/Explanation
(a)
Disagree: The median for women (≈60) is greater than for men (≈50).
Disagree: Men have a smaller IQR (≈40) compared to women (≈50).
(b)(i) Ans: 87.4 minutes
Midpoints: 30, 80, 130, 190, 250. Multiply by frequency: 150, 2400, 3900, 3800, 2000. Sum (12250) ÷ 100 = 122.5.
(ii)(a) Ans: 90 minutes
60th percentile corresponds to 60 on the y-axis, intersecting at 90 minutes.
(ii)(b) Ans: 8
More than 180 minutes: 100 – 92 = 8 children.
(iii) Ans: 4.05 cm
Frequency density for 60-100: 24/40 = 0.6 → 10.8 cm. For 160-220: 27/60 = 0.45 → (0.45/0.6)×10.8 = 4.05 cm.