▶️ Answer/Explanation
Correct Answer: acceleration AND velocity
Detailed solution: Vector quantities are physical quantities that have both magnitude (size) and a specific direction. Among the given options, both acceleration and velocity describe motion with a particular direction. In contrast, mass, speed, and time only possess magnitude without any directional component, which classifies them as scalar quantities.
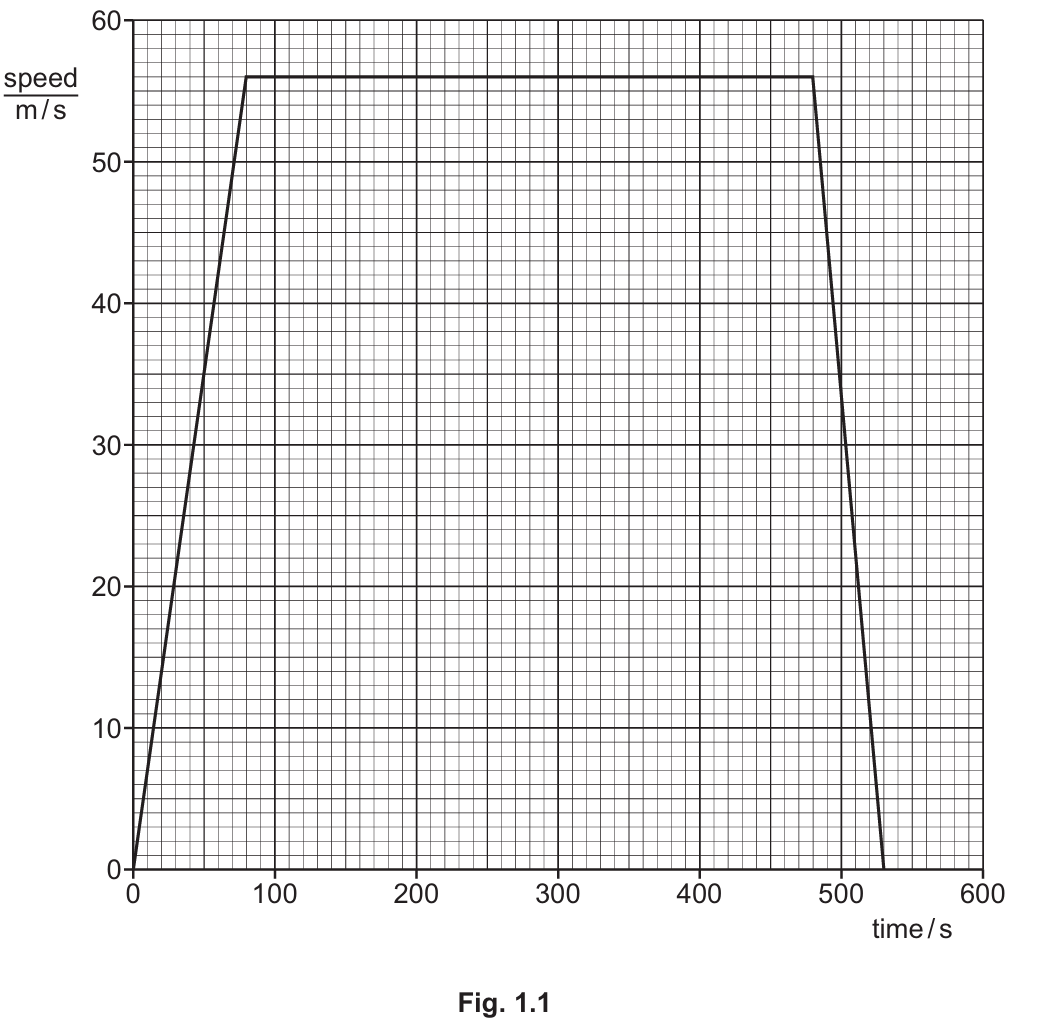
Correct Answer: $56\text{ m/s}$
Detailed solution: On a speed-time graph, the speed of the object is represented on the vertical $y$-axis. The maximum speed achieved by the train corresponds to the highest flat section reached on the graph. Observing the plot, this top horizontal section aligns perfectly with $56$ on the vertical axis, giving a maximum speed of $56\text{ m/s}$.
Correct Answer: The train accelerates at a constant rate, then travels at a constant speed, and finally decelerates at a constant rate.
Detailed solution: The motion is divided into three distinct phases. First, the straight line with a positive gradient from $0\text{ s}$ to $80\text{ s}$ shows that the train undergoes constant acceleration. The horizontal line segment from $80\text{ s}$ to $480\text{ s}$ indicates that the train is moving at a steady, constant speed. Finally, the straight line with a negative gradient from $480\text{ s}$ to $530\text{ s}$ represents constant deceleration until it stops.
Correct Answer: $26000\text{ m}$ (or $26\text{ km}$)
Detailed solution: The total distance travelled equals the area under the speed-time graph. The area can be calculated as a single trapezium using the formula $\text{Area} = \frac{1}{2}(a+b)h$. The parallel sides are the base width $b = 530\text{ s}$ and the top flat section $a = (480 – 80) = 400\text{ s}$. The height $h$ is $56\text{ m/s}$. The calculation is $\frac{1}{2} \times (400 + 530) \times 56 = 26040\text{ m}$, which is generally rounded to $26000\text{ m}$ for two significant figures.
Correct Answer: Lower maximum constant speed (or lower acceleration, or lower deceleration).
Detailed solution: The distance between station A and station B is a fixed value. If the train takes a longer overall time ($650\text{ s}$) to cover this same distance, its average speed must be lower. This reduction in average speed could be caused by reaching a lower maximum speed during the middle of the journey, having a slower rate of acceleration initially, or a lower rate of deceleration at the end.