CIE iGCSE Co-Ordinated Science B14. Drugs Exam Style Questions Paper 1
Question
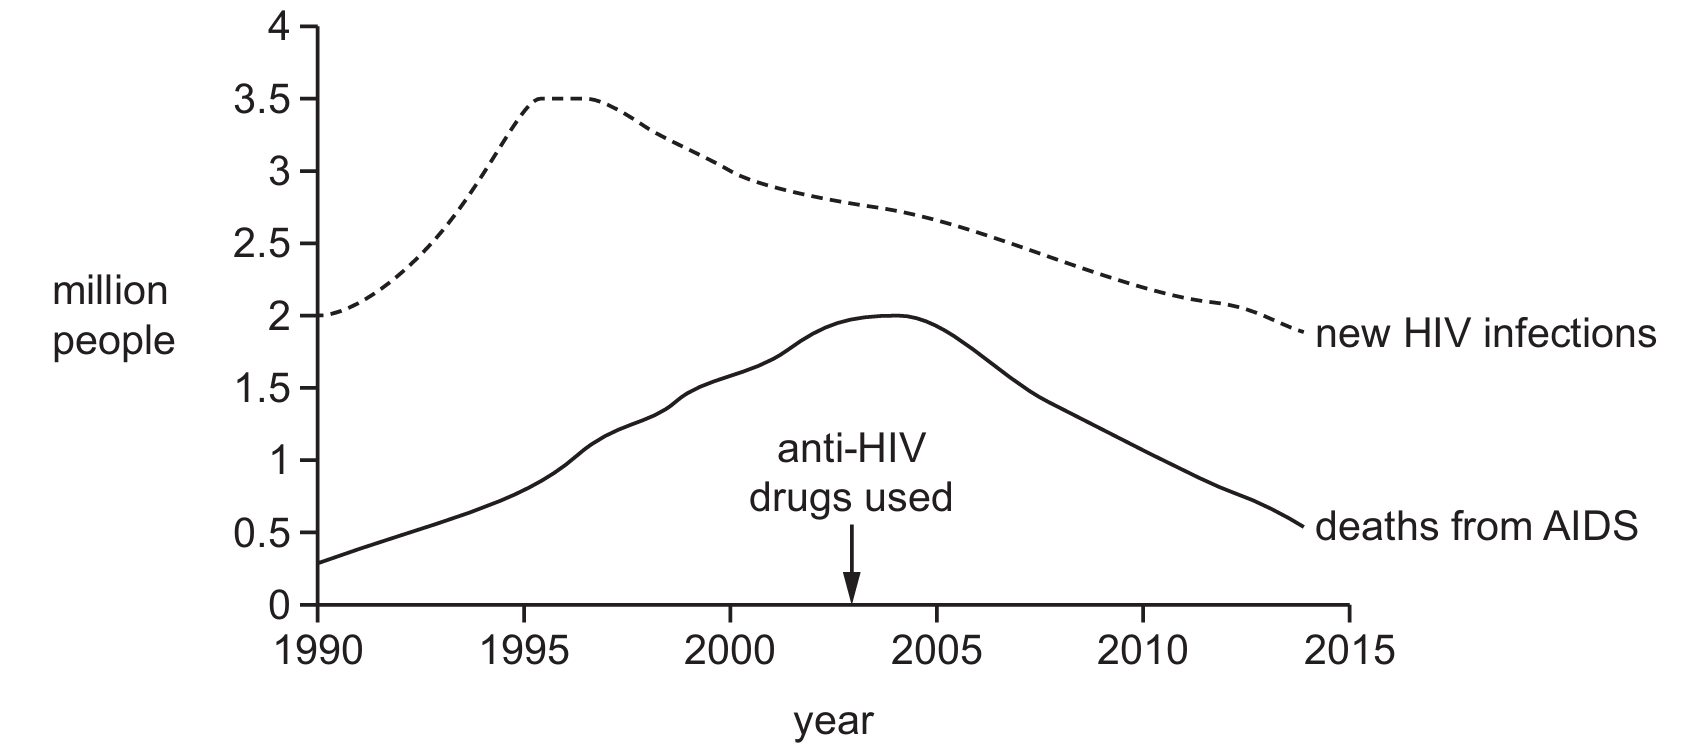
The graph shows the change in number of new HIV infections and deaths from AIDS between 1990 and 2014.

What does the graph show?
- The number of new HIV infections fell after condom use was promoted.
- The use of anti-HIV drugs has led to a decrease in deaths from AIDS.
- The highest rate of deaths from AIDS occurred in 1995.
A. 1 and 2 only
B. 3 only
C. 1, 2 and 3
D. 2 only
▶️ Answer/Explanation
The graph gives no information about condom promotion, so statement 1 cannot be concluded.
Deaths from AIDS fall after anti-HIV drugs are introduced, supporting statement 2, while deaths actually peak later than 1995, so statement 3 is false.
✅ Answer: (D)
Deaths from AIDS fall after anti-HIV drugs are introduced, supporting statement 2, while deaths actually peak later than 1995, so statement 3 is false.
✅ Answer: (D)
