Speed
Speed is the distance travelled per unit time.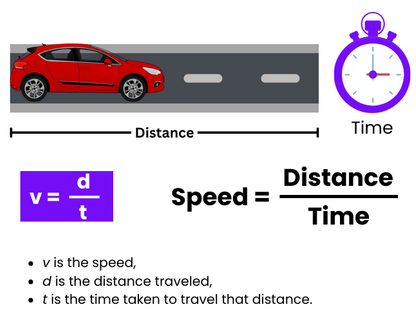
- It tells us how fast an object is moving, but not the direction (so it is a scalar quantity).
- SI unit: metres per second (m/s).
Equation for Speed
\( \text{Speed} = d\frac{\text{Distance travelled}}{\text{Time taken}} \)
- Distance must be in metres (m).
- Time must be in seconds (s).
- Other units are sometimes used (e.g. km/h, cm/s), but must be converted into SI units for calculations.
Example:
A car travels 240 m in 20 s. Find its speed.
▶️ Answer/Explanation
Speed = Distance ÷ Time
= \( 240 \div 20 \)
= \(\boxed{12~\text{m/s}}\)
Example:
A cyclist covers 6 km in 20 minutes. Calculate the speed in m/s.
▶️ Answer/Explanation
Step 1: Convert units
Distance = 6 km = \( 6000~\text{m} \)
Time = 20 min = \( 20 \times 60 = 1200~\text{s} \)
Step 2: Use formula
Speed = \( 6000 \div 1200 = \boxed{5~\text{m/s}} \)
Average Speed
Average speed is the total distance travelled divided by the total time taken.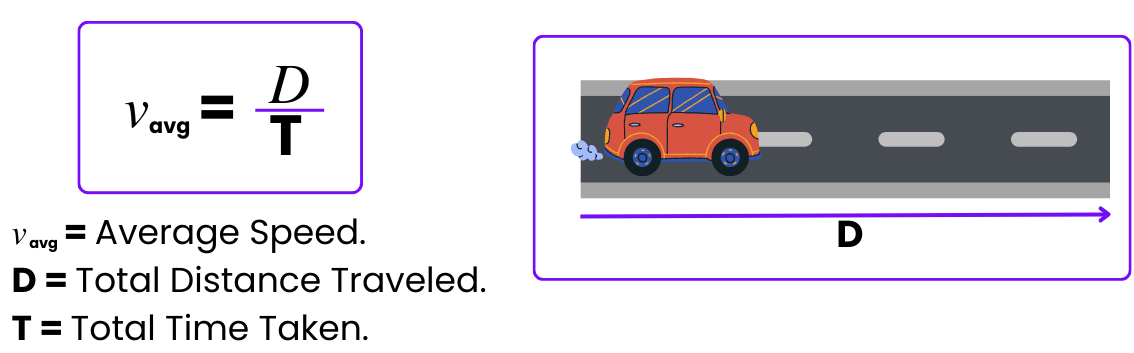
- It is useful when the speed is not constant throughout a journey.
- SI unit: metres per second (m/s).
Equation for Average Speed
\( \text{Average Speed} = \dfrac{\text{Total Distance}}{\text{Total Time}} \)
- Distance must be in metres (m).
- Time must be in seconds (s).
- Other units (e.g. km/h) can be used, but must be consistent.
Example:
A bus travels 60 km in 1.5 hours. Find its average speed in km/h.
▶️ Answer/Explanation
Total distance = \( 60~\text{km} \)
Total time = \( 1.5~\text{h} \)
Average speed = \( \dfrac{60}{1.5} = \boxed{40~\text{km/h}} \)
Example:
A runner completes 400 m in 80 s, then 200 m in 40 s. Find the average speed.
▶️ Answer/Explanation
Total distance = \( 400 + 200 = 600~\text{m} \)
Total time = \( 80 + 40 = 120~\text{s} \)
Average speed = \( \dfrac{600}{120} = \boxed{5~\text{m/s}} \)
Distance–Time and Speed–Time Graphs
Distance–Time Graphs
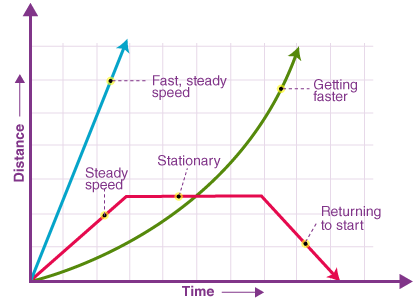
- The gradient (slope) of the graph represents speed.
- A horizontal line → object is at rest (no change in distance).
- A straight sloping line → object moves with constant speed.
- A curved line → object is accelerating or decelerating (speed is changing).
Example: A straight line rising steadily on a distance–time graph means the object is moving at a uniform speed.
Speed–Time Graphs
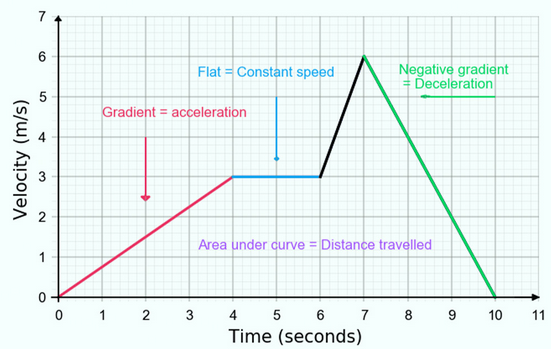
- The gradient (slope) of the graph represents acceleration.
- The area under the graph represents the distance travelled.
- A horizontal line → motion with constant speed.
- A sloping line upwards → object is accelerating.
- A sloping line downwards → object is decelerating.
Example: A speed–time graph with a horizontal line at 10 m/s means the object moves with a constant speed of 10 m/s.
Example:
A student plots a distance–time graph. The line is straight and goes from (0,0) to (10, 50). Find the speed.
▶️ Answer/Explanation
Gradient = \( \dfrac{\text{Change in distance}}{\text{Change in time}} \)
= \( \dfrac{50 – 0}{10 – 0} = \dfrac{50}{10} = \boxed{5~\text{m/s}} \)
Example:
A car accelerates uniformly from rest to 20 m/s in 10 s. Plot a speed–time graph and find the distance travelled.
▶️ Answer/Explanation
Graph: a straight line from (0,0) to (10,20).
Distance = Area under graph = area of triangle.
= \( \dfrac{1}{2} \times \text{base} \times \text{height} \)
= \( \dfrac{1}{2} \times 10 \times 20 = \boxed{100~\text{m}} \)
Acceleration and Deceleration
- An object moving with increasing speed is said to be accelerating.

- An object moving with decreasing speed is said to be decelerating (also called retardation or negative acceleration).
- Both acceleration and deceleration are vector quantities because they involve change in velocity (which has direction).
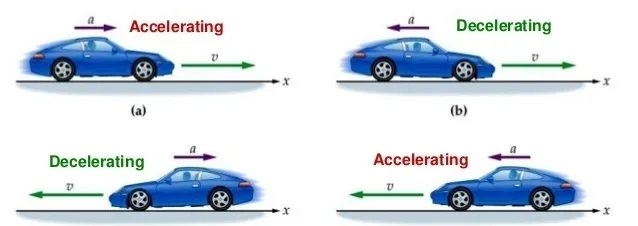
Key Points:
- Acceleration → speed goes up over time (e.g. car speeding up).
- Deceleration → speed goes down over time (e.g. car slowing down at traffic lights).
- On a speed–time graph:
- Upward slope → acceleration.
- Downward slope → deceleration.
Example: If a bus increases its speed from 0 m/s to 15 m/s in 5 seconds, it is accelerating. If it later reduces its speed from 15 m/s to 5 m/s in 4 seconds, it is decelerating.
Example:
A car’s speed increases from 10 m/s to 25 m/s in 5 s. Is it accelerating or decelerating?
▶️ Answer/Explanation
Since speed is increasing, the car is accelerating.
Example:
A bicycle slows down from 12 m/s to 4 m/s in 3 s. Is this acceleration or deceleration?
▶️ Answer/Explanation
Since speed is decreasing, the bicycle is decelerating.
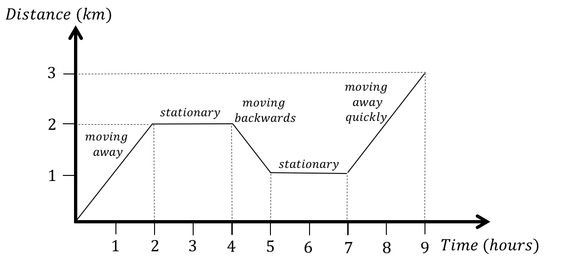
Interpreting Distance–Time and Speed–Time Graphs
Graphs are very useful for understanding the motion of an object. From the shape of the graph, we can determine if an object is at rest, moving at constant speed, accelerating, or decelerating.
1. Distance–Time Graphs
- (a) At Rest:
- A horizontal line (flat line, distance does not change with time).
- Example: An object placed on a table without moving.
- (b) Moving with Constant Speed:
- A straight sloping line (distance increases at a uniform rate).
- Steeper line → higher speed, less steep → lower speed.
- Example: A car moving on a straight road at 20 m/s.
- (c) Accelerating:
- A curved line bending upwards (slope gets steeper with time).
- Distance increases more quickly as time passes.
- Example: A car starting from rest and speeding up.
- (d) Decelerating:
- A curved line bending downwards (slope gets less steep with time).
- Distance increases but more slowly — object is slowing down.
- Example: A car applying brakes.
2. Speed–Time Graphs

- (a) At Rest:
- A horizontal line on the time axis (speed = 0).
- Example: A parked car.
- (b) Moving with Constant Speed:
- A horizontal line above the time axis (speed stays the same).
- Example: A bus cruising at 15 m/s.
- (c) Accelerating:
- A sloping line upwards (speed increases with time).
- Steeper slope → greater acceleration.
- Example: A motorbike speeding up.
- (d) Decelerating:
- A sloping line downwards (speed decreases with time).
- Steeper slope → greater deceleration.
- Example: A train slowing down as it reaches a station.
Example:
A car moves along a straight road. The distance–time graph is drawn in three parts:
- From 0–5 s, the graph is a straight line sloping upwards.
- From 5–10 s, the graph is a horizontal line.
- From 10–15 s, the graph is a curve bending upwards (getting steeper).
Describe the motion of the car in each time interval.
▶️ Answer/Explanation
Step 1: 0–5 s → Straight sloping line → distance increases uniformly → the car is moving at constant speed.
Step 2: 5–10 s → Horizontal line → distance does not change → the car is at rest.
Step 3: 10–15 s → Curve bending upwards → slope gets steeper → distance increases more quickly → the car is accelerating.
Example:
A student draws a distance–time graph. The graph is a straight line starting from the origin and rising uniformly. What does it show?
▶️ Answer/Explanation
The graph is a straight line → object is moving at constant speed.
Example :
The speed–time graph of a car shows a straight line sloping downwards from 25 m/s to 0 m/s in 10 seconds. What is happening?
▶️ Answer/Explanation
The graph slopes downward → speed decreases → the car is decelerating.
Velocity
Velocity is the speed of an object in a given direction.
- It is a vector quantity because it has both:
- Magnitude → the speed (how fast the object is moving)
- Direction → the line along which the object moves
- Two objects can have the same speed but different velocities if they are moving in different directions.
- The SI unit of velocity is the same as speed: \( \text{m/s} \).
Example: A car moving at \( 20~\text{m/s} \) towards the north has a velocity of \( 20~\text{m/s north} \). Another car moving at \( 20~\text{m/s} \) towards the east has the same speed, but its velocity is different because the direction is different.
Comparison: Speed vs Velocity
| Aspect | Speed | Velocity |
|---|---|---|
| Definition | Distance travelled per unit time | Speed of an object in a given direction |
| Quantity Type | Scalar (magnitude only) | Vector (magnitude + direction) |
| Can be Negative? | No, always positive | Yes, depends on direction |
| Example | A car moves at \(30~\text{m/s}\) | A car moves at \(30~\text{m/s east}\) |
| SI Unit | \( \text{m/s} \) | \( \text{m/s} \) (with direction) |
Example:
A boat sails at \( 15~\text{m/s} \) east. What is its velocity?
▶️ Answer/Explanation
Speed of the boat = \( 15~\text{m/s} \)
Direction = East
Therefore, velocity = \( \mathbf{15~\text{m/s east}} \)
Example:
A car travels at \( 20~\text{m/s} \) due north for 30 seconds. Then it turns and continues at the same speed of \( 20~\text{m/s} \) due east. Compare its speed and velocity before and after the turn.
▶️ Answer/Explanation
Before the turn:
Speed = \( 20~\text{m/s} \), Direction = north → Velocity = \( 20~\text{m/s north} \).
After the turn:
Speed = \( 20~\text{m/s} \), Direction = east → Velocity = \( 20~\text{m/s east} \).
Conclusion: The speed of the car remains the same, but its velocity changes because the direction has changed.
Acceleration
Acceleration is the rate of change of velocity per unit time.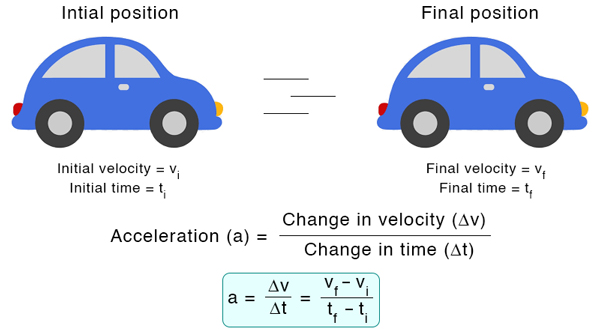
- It tells us how quickly an object is speeding up or slowing down.
- SI Unit: \( \text{m/s}^2 \)
Equation for Acceleration:
$a = \dfrac{\Delta v}{t} = \dfrac{v – u}{t}$
- \( a \) = acceleration (\( \text{m/s}^2 \))
- \( v \) = final velocity (\( \text{m/s} \))
- \( u \) = initial velocity (\( \text{m/s} \))
- \( t \) = time taken (s)
Example:
A car increases its velocity from \( 10~\text{m/s} \) to \( 25~\text{m/s} \) in \( 5~\text{s} \). Find its acceleration.
▶️ Answer/Explanation
Initial velocity, \( u = 10~\text{m/s} \)
Final velocity, \( v = 25~\text{m/s} \)
Time taken, \( t = 5~\text{s} \)
\( a = \dfrac{v – u}{t} = \dfrac{25 – 10}{5} = \dfrac{15}{5} = \boxed{3~\text{m/s}^2} \)
Example:
A motorcycle is moving at \( 20~\text{m/s} \). The rider applies brakes and the speed reduces uniformly to \( 8~\text{m/s} \) in \( 4~\text{s} \). Find the acceleration of the motorcycle. State whether it is acceleration or deceleration.
▶️ Answer/Explanation
Initial velocity, \( u = 20~\text{m/s} \)
Final velocity, \( v = 8~\text{m/s} \)
Time taken, \( t = 4~\text{s} \)
Using formula: \( a = \dfrac{v – u}{t} \)
\( a = \dfrac{8 – 20}{4} = \dfrac{-12}{4} = -3~\text{m/s}^2 \)
Therefore: The motorcycle has a deceleration of \( \boxed{3~\text{m/s}^2} \).
Determining Constant vs Changing Acceleration
Acceleration is the rate of change of velocity with time. $a = \dfrac{\Delta v}{\Delta t} = \dfrac{v – u}{t} $
- To decide whether acceleration is constant or changing, you can use either a speed–time graph or a set of numerical data (times and speeds).
From a Speed–Time Graph

- Constant acceleration: the speed–time graph is a straight line (linear) — slope (gradient) is constant.
- Upward straight line → constant positive acceleration.
- Downward straight line → constant negative acceleration (deceleration).
- Changing acceleration: the speed–time graph is curved (non-linear) — slope changes with time.
- If the slope gradually increases (curve getting steeper) → acceleration increasing with time.
- If the slope gradually decreases (curve flattening) → acceleration decreasing with time.
- Quick check: pick two separate small time intervals on the graph, find the slopes (rise/run) — if the slopes are equal, acceleration is constant; if slopes differ, acceleration is changing.
From Numerical Data (times & speeds)
- Calculate the acceleration for successive intervals using \( a_{i} = \dfrac{v_{i+1} – v_{i}}{t_{i+1} – t_{i}} \)
- Constant acceleration: all calculated \( a_i \) values are (within experimental uncertainty) the same number.
- Changing acceleration: the \( a_i \) values vary noticeably from one interval to the next.
- Be careful with units and with rounding compute each difference explicitly to avoid arithmetic mistakes.
Example
Graph A is a straight line from (0 s, 0 m/s) to (6 s, 12 m/s). Graph B is a curved line that starts at (0 s, 0 m/s), at 2 s is 5 m/s, at 4 s is 11 m/s, at 6 s is 18 m/s.
Which graph shows constant acceleration and which shows changing acceleration? Explain.
▶️ Answer/Explanation
Graph A — straight line from (0,0) to (6,12): slope = \(\dfrac{12-0}{6-0}=\dfrac{12}{6}=2~\text{m/s}^2\). The slope is constant, so acceleration is constant (2 m/s²).
Graph B — curve with speeds 0 → 5 → 11 → 18 at t = 0,2,4,6 s respectively. The slope is changing (points do not lie on a single straight line) so the acceleration is changing. (We confirm numerically in the next example.)
Example
Given speeds at equal time steps:
- t = 0 s, v = 0 m/s
- t = 2 s, v = 5 m/s
- t = 4 s, v = 11 m/s
- t = 6 s, v = 18 m/s
Calculate accelerations for each interval and decide whether acceleration is constant or changing.
▶️ Answer/Explanation
Compute acceleration on each interval (use \( a = \dfrac{\Delta v}{\Delta t} \)) — work out each step carefully:
Interval 1: 0 → 2 s
\( a_1 = \dfrac{v(2) – v(0)}{2 – 0} = \dfrac{5 – 0}{2} = \dfrac{5}{2} = 2.5~\text{m/s}^2 \)
Interval 2: 2 → 4 s
\( a_2 = \dfrac{v(4) – v(2)}{4 – 2} = \dfrac{11 – 5}{2} = \dfrac{6}{2} = 3.0~\text{m/s}^2 \)
Interval 3: 4 → 6 s
\( a_3 = \dfrac{v(6) – v(4)}{6 – 4} = \dfrac{18 – 11}{2} = \dfrac{7}{2} = 3.5~\text{m/s}^2 \)
Results: \( a_1 = 2.5 \), \( a_2 = 3.0 \), \( a_3 = 3.5~\text{m/s}^2 \). Since the accelerations change from one interval to the next, the acceleration is changing (increasing).