Averages and Measures of Spread : Mean
The mean is the sum of all data values divided by the number of values. It is also known as the arithmetic average.
Formula:
\( \text{Mean} = \dfrac{\text{Sum of values}}{\text{Number of values}} \)
The mean is best used when the data does not have extreme values (outliers) which can distort the average.
Example:
Find the mean of the following data: 5, 9, 12, 15, 19.
▶️ Answer/Explanation
Sum = 5 + 9 + 12 + 15 + 19 = 60
Number of values = 5
Mean = \( \dfrac{60}{5} = \boxed{12} \)
Example:
The table shows the number of books read by a group of students last month.
| Books Read | Number of Students (Frequency) |
|---|---|
| 0 | 4 |
| 1 | 6 |
| 2 | 5 |
| 3 | 3 |
▶️ Answer/Explanation
Use the formula for mean with frequencies:
\( \text{Mean} = \dfrac{\sum fx}{\sum f} \)
Where \( f \) is the frequency and \( x \) is the value
- \( (0 \times 4) + (1 \times 6) + (2 \times 5) + (3 \times 3) = 0 + 6 + 10 + 9 = 25 \)
- Total frequency = 4 + 6 + 5 + 3 = 18
Mean = \( \dfrac{25}{18} \approx \boxed{1.39} \)
Note: The mean is affected by extreme values. If there are unusually large or small numbers in the data, consider using the median instead.
Averages and Measures of Spread : Median
The median is the middle value when data is arranged in numerical order. It is not affected by extreme values (outliers) and is useful for skewed data.
How to find the median:
- If the number of values is odd, the median is the middle number.
- If the number of values is even, the median is the average of the two middle numbers.
Example:
Find the median of the following values: 9, 5, 13, 7, 11.
▶️ Answer/Explanation
Arrange in order: 5, 7, 9, 11, 13
Middle value = \( \boxed{9} \)
Example:
Find the median of 4, 8, 12, 16, 20, 24.
▶️ Answer/Explanation
Arrange in order (already done)
Middle values = 12 and 16
Median = \( \dfrac{12 + 16}{2} = \dfrac{28}{2} = \boxed{14} \)
Median from a frequency table:
- Find the cumulative frequency.
- Locate the middle value ( \( \dfrac{n+1}{2} \) if individual data or \( \dfrac{n}{2} \) if grouped).
- Identify the class that contains the median.
Example:
The table shows the ages of students in a club.
| Age (years) | Frequency |
|---|---|
| 10–12 | 5 |
| 13–15 | 8 |
| 16–18 | 7 |
▶️ Answer/Explanation
Total frequency = 5 + 8 + 7 = 20
Median position = \( \dfrac{20}{2} = 10 \)
Cumulative frequency: 5 (first class),(5+8)= 13 (second class), (5+8+7)=20 (third class)
The 10th value is in the 13–15 class → this is the median class.
So, median age is in range \( \boxed{13\text{–}15} \)
Note: The median is not affected by extreme values. It gives a better picture of typical values in skewed distributions.
Averages and Measures of Spread : Mode
The mode is the value that appears most frequently in a data set. A data set can have:
- One mode (unimodal)
- Two modes (bimodal)
- No mode (if all values occur equally)
Mode is especially useful for categorical or discrete data.
Example:
Find the mode of the following values: 3, 5, 5, 7, 9, 5, 11.
▶️ Answer/Explanation
5 appears 3 times, more than any other number.
Mode = \( \boxed{5} \)
Example :
The table shows the number of goals scored in matches.
| Goals | Frequency |
|---|---|
| 0 | 2 |
| 1 | 5 |
| 2 | 8 |
| 3 | 3 |
▶️ Answer/Explanation
Goal value 2 has the highest frequency (8 times).
Mode = \( \boxed{2} \)
Note: The mode may not exist or may not be useful for continuous data unless data is grouped into intervals. It is best for identifying the most common value.
Averages and Measures of Spread : Quartiles
Quartiles divide a data set into four equal parts. They are useful for describing the spread and identifying outliers.
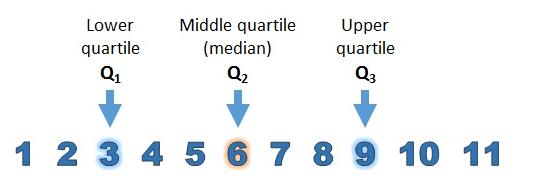
- Lower Quartile (Q1): The median of the lower half of the data (below the overall median).
- Upper Quartile (Q3): The median of the upper half of the data (above the overall median).
- Interquartile Range (IQR): The difference between Q3 and Q1: \( \text{IQR} = Q_3 – Q_1 \)
Quartiles are used to measure spread and detect skewness or outliers.
Example:
Find the lower and upper quartiles for the data: 2, 4, 6, 8, 10, 12, 14
▶️ Answer/Explanation
Step 1: Arrange the data (already in order).
Step 2: Median = middle value = 8
Step 3: Lower half = 2, 4, 6 → Q1 = median = 4
Step 4: Upper half = 10, 12, 14 → Q3 = median = 12
Answer: \( Q_1 = \boxed{4},\quad Q_3 = \boxed{12} \)
Example:
Find the quartiles for the data: 5, 6, 7, 8, 9, 10, 12, 14
▶️ Answer/Explanation
Step 1: Data is in order.
Step 2: Total values = 8 (even number), so median = average of 4th and 5th values = \( \frac{8 + 9}{2} = 8.5 \)
Step 3: Lower half = 5, 6, 7, 8 → Q1 = median = \( \frac{6 + 7}{2} = 6.5 \)
Step 4: Upper half = 9, 10, 12, 14 → Q3 = median = \( \frac{10 + 12}{2} = 11 \)
Answer: \( Q_1 = \boxed{6.5},\quad Q_3 = \boxed{11} \)
Tip: Use quartiles to find the IQR (spread of middle 50% of the data), especially useful when the data contains outliers.
Averages and Measures of Spread : Range and Interquartile Range
Measures of spread tell us how spread out the values in a data set are. Two common measures are:
- Range: Difference between the largest and smallest value
- Interquartile Range (IQR): Difference between the upper quartile (Q3) and the lower quartile (Q1):
\( \text{IQR} = Q_3 – Q_1 \)
Use: IQR is a better measure of spread than range when data contains extreme values or outliers.
Example:
Find the range and interquartile range of the data: 2, 4, 6, 8, 10, 12, 14
▶️ Answer/Explanation
Range = largest − smallest = 14 − 2 = \( \boxed{12} \)
Q1 = 4, Q3 = 12
IQR = \( Q_3 – Q_1 = 12 – 4 = \boxed{8} \)
Example:
The data set is: 3, 7, 8, 10, 12, 13, 16, 18, 20
▶️ Answer/Explanation
Step 1: Range = 20 − 3 = \( \boxed{17} \)
Step 2: Median = 12
Lower half = 3, 7, 8, 10 → Q1 = average of 7 and 8 = \( \boxed{7.5} \)
Upper half = 13, 16, 18, 20 → Q3 = average of 16 and 18 = \( \boxed{17} \)
IQR = \( 17 – 7.5 = \boxed{9.5} \)
Tip: The IQR is not affected by outliers, so it is useful for comparing the spread of skewed data.