Drawing Linear Graphs
Linear graphs represent equations of the form \( y = mx + c \), where:

- m is the gradient (slope) of the line — it tells you how steep the line is.
- c is the y-intercept — where the line crosses the y-axis.
How to Draw a Linear Graph:
- Make a table of values: Choose values of \( x \), substitute into the equation, and find the corresponding \( y \).
- Plot the points \( (x, y) \) on a Cartesian grid.
- Join the points with a straight line.
Important Tips:
- Use at least 3 points to ensure accuracy when drawing the line.
- Extend the line across the grid and label the equation on the line.
Example:
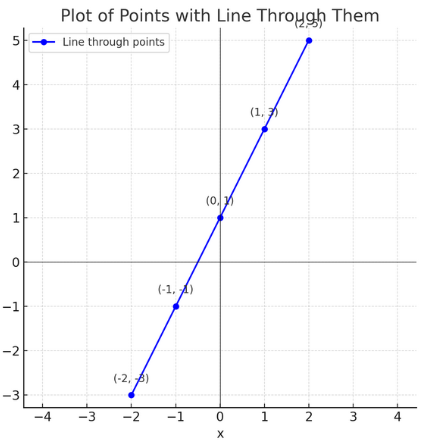
Draw the graph of \( y = 2x + 1 \) for values of \( x \) from -2 to 2.
▶️ Answer/Explanation
Create a table of values:
| \( x \) | -2 | -1 | 0 | 1 | 2 |
| \( y = 2x + 1 \) | -3 | -1 | 1 | 3 | 5 |
Plot these points: (-2, -3), (-1, -1), (0, 1), (1, 3), (2, 5), then draw a straight line through them.
Example:
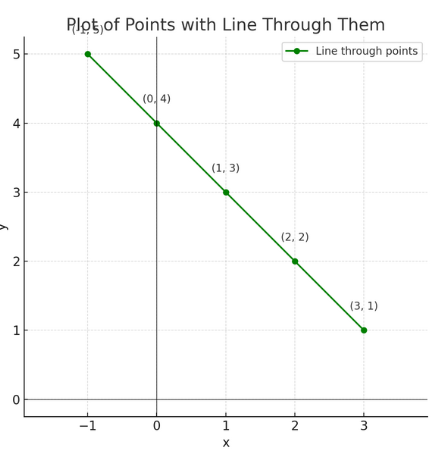
Draw the graph of \( y = -x + 4 \) for values of \( x \) from -1 to 3.
▶️ Answer/Explanation
Table of values:
| \( x \) | -1 | 0 | 1 | 2 | 3 |
|---|---|---|---|---|---|
| \( y = -x + 4 \) | 5 | 4 | 3 | 2 | 1 |
Plot the points: (-1, 5), (0, 4), (1, 3), (2, 2), (3, 1), and draw the line.
Example:
The graph below represents the linear equation:

Using the equation, determine the following:
- The slope \( m \) of the line
- The y-intercept \( c \) of the line
▶️ Answer/Explanation
Solution:
The given equation is in the form \( y = mx + c \), where:
\( m = -3 \) (slope)
\( c = 7 \) (y-intercept)