Interpreting Graphs in Real-Life Contexts
Graphs are used to represent real-life situations such as distance–time, speed–time, and conversion graphs. They help us analyse how two quantities relate over time or under changing conditions.
Types of Practical Graphs
- Travel Graphs (Distance–Time Graphs): Show how distance changes over time. The slope/gradient represents speed.
- Conversion Graphs: Show the relationship between two units, e.g. miles and kilometers, dollars and euros.
Key Skills:
- Read and estimate values from a graph.
- Interpret slope/gradient and flat/horizontal parts.
- Identify sections showing constant speed, rest, or change in direction.
Example:
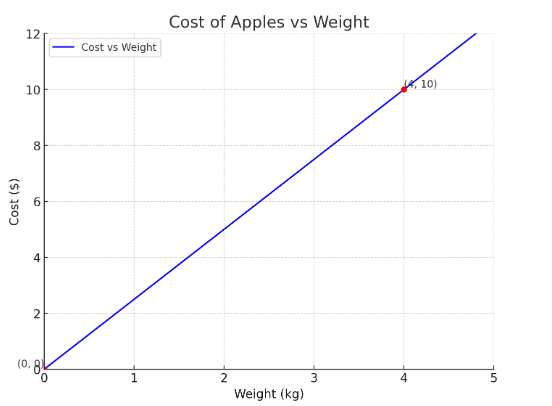
The graph shows the cost (in $\$$) of apples based on weight (in kg). The graph passes through the origin and the point (4, 10).
▶️ Answer/Explanation
Step 1: Find the gradient:
Gradient = \( \frac{10 – 0}{4 – 0} = \frac{10}{4} = 2.5 \)
Step 2: Interpret the gradient:
This means the cost increases by $\$2.50$ for every 1 kg of apples. So the rate of change is $\$2.50/kg$ — this is the price per kilogram.
Answer: The gradient represents the unit price of apples: $\$2.50$ per kg.
Example :
A conversion graph shows how pounds (£) convert to euros (€). If £20 = €24, use the graph or ratio to find how many euros for £35.
▶️ Answer/Explanation
\( \frac{24}{20} = 1.2 \) → 1 pound = 1.2 euros
\( 35 \times 1.2 = 42 \)
Answer: €42
If using a graph, find £35 on the x-axis and trace up to the graph line, then across to read the corresponding euro value on the y-axis.
Tips:
- Always label axes clearly and include units (e.g. time in minutes, distance in km).
- For travel graphs: slope = speed. For conversion graphs: slope = rate of conversion.
- Use a ruler to trace values from axes to read intermediate points accurately.
Draw Graphs from Given Data
Drawing graphs from data helps visualize how quantities change over time or across different conditions. The most common type in practical contexts is the distance–time graph.
Steps to Draw a Distance–Time Graph:
- Label the axes correctly: Time (usually x-axis) and Distance (y-axis).
- Choose a suitable scale for both axes.
- Plot each data point carefully.
- Join the points using straight lines or curves, depending on the situation.
- Use labels and a title if needed.
Example:
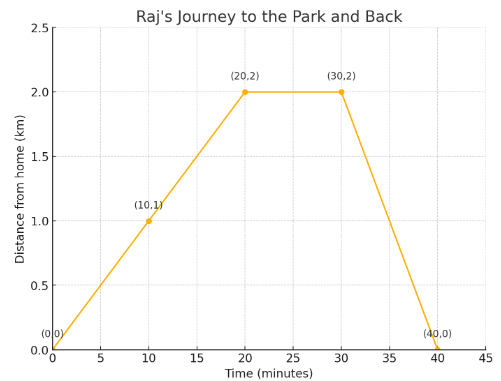
The table below shows Raj’s journey from home to a park:
| Time (minutes) | Distance (km) |
|---|---|
| 0 | 0 |
| 10 | 1 |
| 20 | 2 |
| 30 | 2 |
| 40 | 0 |
▶️ Answer/Explanation
- From 0–20 mins, the distance increases steadily → Raj is walking to the park.
- From 20–30 mins, distance is constant → Raj rests at the park.
- From 30–40 mins, distance decreases → Raj returns home.
Plot the points (0,0), (10,1), (20,2), (30,2), (40,0) and connect them appropriately.
Tips:
- Use a ruler for straight lines and mark all points clearly.
- Check if any parts are curved (e.g., for acceleration) — these require smooth lines.
- Use breaks or symbols if values skip large ranges.
Rate of Change in Kinematics
In kinematics, rate of change helps interpret how a quantity (like distance or speed) changes with respect to time.
Distance–Time Graphs:
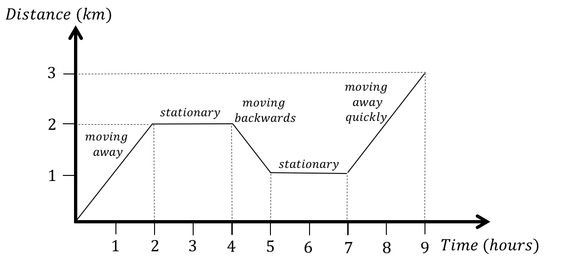
- Gradient = speed → \( \text{Speed} = \frac{\text{Distance}}{\text{Time}} \)
- Horizontal line = object is stationary
- Steeper line = higher speed
- Changing gradient = changing speed
Speed–Time Graphs:
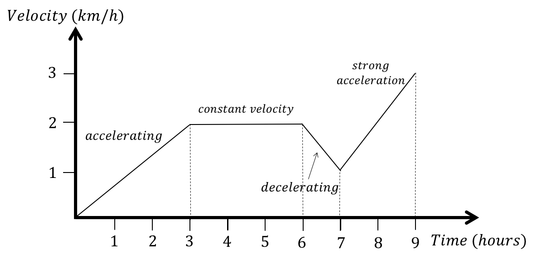
- Gradient = acceleration or deceleration
- Area under the graph = distance travelled
- Horizontal line = constant speed
- Upward slope = acceleration
- Downward slope = deceleration
Acceleration:
\( \text{Acceleration} = \frac{\text{Change in speed}}{\text{Time}} = \frac{v – u}{t} \)
Example:
An object moves 100 m in 20 seconds. Find its speed.
▶️ Answer/Explanation
Speed = \( \frac{100}{20} = 5 \ \text{m/s} \)
Example:
An object increases its speed from 0 m/s to 20 m/s in 4 seconds. Find the acceleration.
▶️ Answer/Explanation
Acceleration = \( \frac{20 – 0}{4} = 5 \ \text{m/s}^2 \)
Example:
Margaret went on a cycle ride.The travel graph shows Margaret’s distance from home on this cycle ride.

(a) How far had Margaret cycled after 30 minutes?
(b) After 60 minutes, Margaret stopped for a rest.
For how many minutes did she rest?
(c) How far did Margaret cycle in total on her ride?
▶️ Answers/Explanations
(a)
From the graph, at 30 minutes, the distance from home is 6 km.
Answer: \(\boxed{6~\text{km}}\)
(b)
Margaret remained at 12 km from 60 minutes to 80 minutes.
So, she rested for \(80 – 60 = 20\) minutes.
Answer: \(\boxed{20~\text{minutes}}\)
(c)
Margaret cycled 12 km away from home and then returned 12 km.
Total distance cycled = \(12 + 12 = 24\) km.
Answer: \(\boxed{24~\text{km}}\)
Example:
The speed-time graph below shows the motion of a vehicle over a period of 30 seconds.
Use the graph to calculate the total distance travelled by the vehicle in 30 seconds.
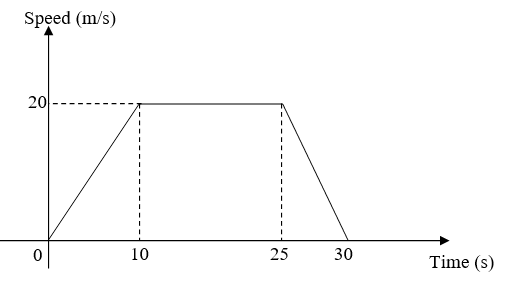
Break the graph into the following intervals and calculate the distance for each:
- From 0 to 10 seconds (acceleration)
- From 10 to 25 seconds (constant speed)
- From 25 to 30 seconds (deceleration)
▶️ Answer/Explanation
From 0 s to 10 s (acceleration):
This is a triangle:
Distance = \( \frac{1}{2} \times \text{base} \times \text{height} = \frac{1}{2} \times 10 \times 20 = \boxed{100~\text{m}} \)
From 10 s to 25 s (constant speed):
This is a rectangle:
Distance = \( \text{width} \times \text{height} = 15 \times 20 = \boxed{300~\text{m}} \)
From 25 s to 30 s (deceleration):
This is another triangle:
Distance = \( \frac{1}{2} \times 5 \times 20 = \boxed{50~\text{m}} \)
Total Distance Travelled:
\( 100 + 300 + 50 = \boxed{450~\text{m}} \)