Inequalities
An inequality compares two expressions and shows the relationship between them when they are not equal. Instead of using the equals sign (=), inequalities use special symbols to express a range of possible values.
Symbols Used in Inequalities
- \( x < a \): means x is less than a
- \( x \leq a \): means x is less than or equal to a
- \( x > a \): means x is greater than a
- \( x \geq a \): means x is greater than or equal to a

Solving Inequalities
Solving inequalities follows the same rules as solving equations. However, when you multiply or divide both sides of an inequality by a negative number, you must reverse the inequality sign.
Example:
If \( -2x > 6 \), divide both sides by -2 (and flip the sign): \( x < -3 \)
Representing Inequalities on a Number Line
We use a number line to visually show the values that satisfy an inequality.
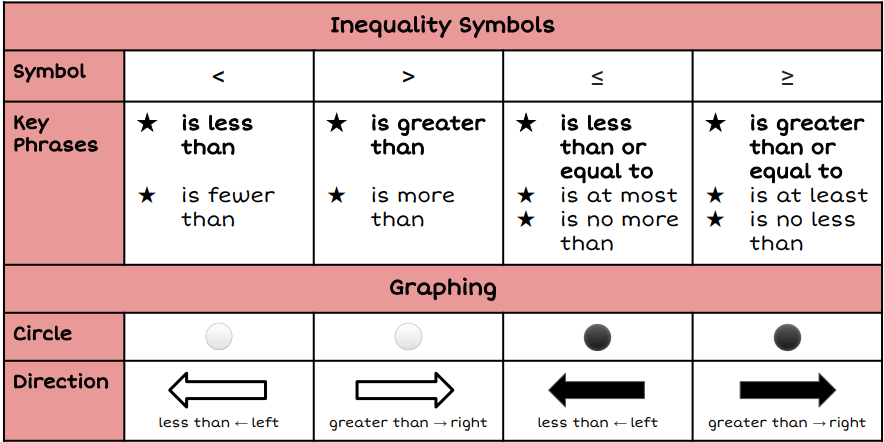
- Open circle: used for strict inequalities (< or >)
- Closed circle: used for inclusive inequalities (≤ or ≥)
- Shade or draw an arrow in the direction of increasing or decreasing values.
Examples of Graphical Representation
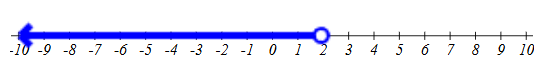
- \( x < 2 \): open circle at 2, line to the left

- \( x \geq -3 \): closed circle at -3, line to the right
Compound Inequalities
A compound inequality is a combination of two inequalities that are combined by either using “and” or “or”. The process of solving each of the inequalities in the compound inequalities is as same as that of a normal inequality but just while combining the solutions of both inequalities depends upon whether they are clubbed by using “and” or “or”.
$a < x < b$ is equivalent to $a < x$ and $x < b$
$a \le x \le b$ is equivalent to $a \le x$ and $x \le b$
$a > x > b$ is equivalent to $a > x$ and $x > b$
$a \ge x \ge b$ is equivalent to $a \ge x$ and $x \ge b$
Sometimes you are given inequalities like this:
\( -2 < x < 4 \) means values of \( x \) are greater than -2 and less than 4.
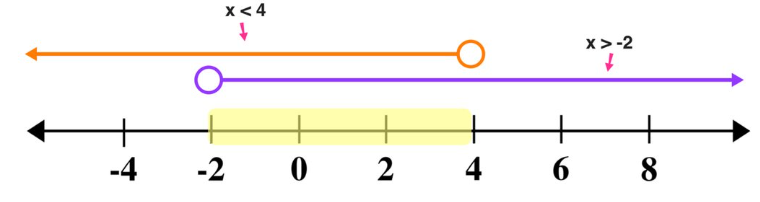
Use an open circle at 2 and a open circle at 4, shading in between.
Note: If there is no intersection (No common portion) , then there will be no solution.
Key Tips:
- Treat inequalities like equations unless multiplying/dividing by negative numbers.
- Always draw open/closed circles accurately based on the sign.
- Test values to check if they satisfy the inequality.
Example :
Solve the inequality: \( x + 3 < 7 \) and represent it on a number line.
▶️ Answer/Explanation
\( x + 3 < 7 \)
Subtract 3 from both sides: \( x < 4 \)
Answer: \( x < 4 \)
Number Line: Open circle at 4, arrow pointing left.
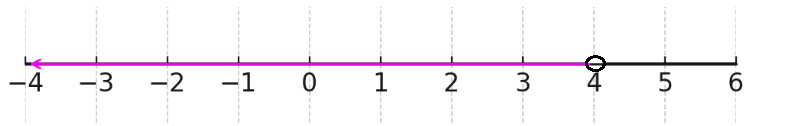
Example :
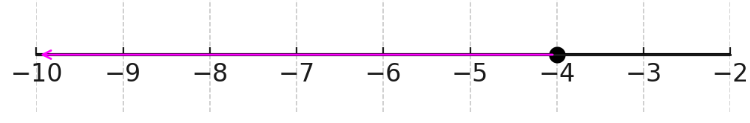
Solve the inequality: \( -2x \geq 8 \) and represent it on a number line.
▶️ Answer/Explanation
\( -2x \geq 8 \)
Divide both sides by -2 and reverse the sign: \( x \leq -4 \)
Answer: \( x \leq -4 \)
Number Line: Closed circle at -4, arrow pointing left.
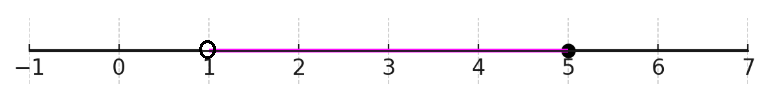
Example :
Solve the compound inequality: \( 1 < x \leq 5 \)
▶️ Answer/Explanation
This is already solved. Just interpret it:
\( x \) is greater than 1 but less than or equal to 5
Answer: All real values between 1 and 5, not including 1 but including 5.
Number Line: Open circle at 1, closed circle at 5, shaded region in between.
Representing and Interpreting Linear Inequalities Graphically
A linear inequality in two variables (e.g. \( y \leq 2x + 1 \)) represents a region on the coordinate plane. The solution set includes all the points that satisfy the inequality.
Steps to Represent a Linear Inequality Graphically:
- Rewrite the inequality in the form \( y \, \square \, mx + c \), where \( \square \) can be <, >, ≤, or ≥.
- Draw the boundary line corresponding to the related equation \( y = mx + c \).
- Use a solid line for ≤ or ≥, and a dashed line for < or >.
- Shade the region that satisfies the inequality. Use a test point (usually the origin) to decide which side to shade.
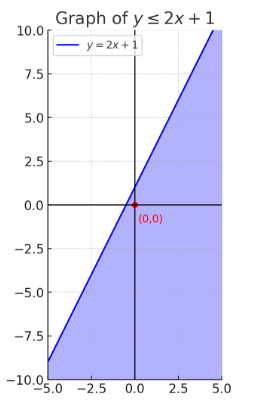
Example :
Represent the inequality \( y \leq 2x + 1 \) graphically.
▶️ Answer/Explanation
- Step 1: Draw the line \( y = 2x + 1 \)
- Step 2: Use a solid line because the inequality is “≤”
- Step 3: Use test point (0,0):
\( 0 \leq 2(0) + 1 \Rightarrow 0 \leq 1 \) → True - Step 4: Shade the region below or on the line
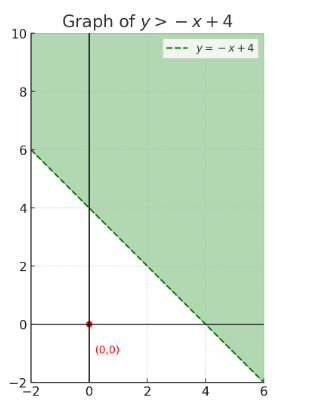
Example:
Represent the inequality \( y > -x + 4 \) graphically.
▶️ Answer/Explanation
- Step 1: Draw the line \( y = -x + 4 \)
- Step 2: Use a dashed line because the inequality is “>”
- Step 3: Test point (0,0):
\( 0 > -0 + 4 \Rightarrow 0 > 4 \) → False - Step 4: Shade the region above the line
Listing Inequalities from a Shaded Region
If a region is already drawn or shaded on a graph, you may be asked to write down the inequalities that define it. These inequalities describe the boundaries and the side of each line the region lies on.
Key Steps:
- Identify each boundary line and write the equation of the line (e.g. \( y = 2x + 1 \), \( x = 4 \), etc.)
- Decide whether the region is on the “greater than” or “less than” side by using a test point.
- Use the correct inequality sign:
- Solid line: Use ≤ or ≥
- Dashed line: Use < or >
Example:
A region is bounded and shaded within the lines:
- \( y = 2x + 1 \) (solid line, region below)
- \( y = -x + 5 \) (dashed line, region above)
- \( x = 1 \) (solid line, region to the right)
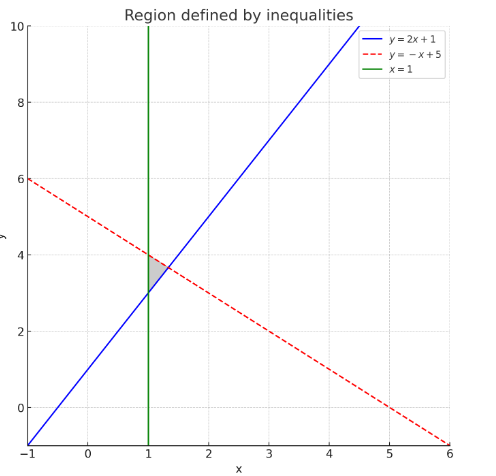
Write down the inequalities that define this region.
▶️ Answer/Explanation
- \( y \leq 2x + 1 \) → below the solid line
- \( y > -x + 5 \) → above the dashed line
- \( x \geq 1 \) → to the right of vertical line \( x = 1 \)
Final set of inequalities:
\( y \leq 2x + 1 \), \( y > -x + 5 \), \( x \geq 1 \)