Home / iGCSE / iGCSE Maths 0580 / Maths (0580) Study Notes / CIE IGCSE Mathematics (0580) Interpreting statistical data Study Notes

CIE IGCSE Mathematics (0580) Interpreting statistical data Study Notes

CIE IGCSE Mathematics (0580) Interpreting statistical data Study Notes - New Syllabus

CIE IGCSE Mathematics (0580) Interpreting statistical data Study Notes

LEARNING OBJECTIVE

  • Interpreting Statistical Data

Key Concepts: 

  • Interpreting Statistical Data
  • Comparing Sets of Data

CIE iGCSE Maths (0580)  Study Notes – All topics

Interpreting Statistical Data

Interpreting Statistical Data

1. Reading and Interpreting Statistical Tables

Statistical tables organize data for easy reference. You may be asked to find specific values, calculate totals or averages, or compare categories.

Example :

The table below shows the number of books borrowed from a library over 5 days.

DayBooks Borrowed
Monday48
Tuesday52
Wednesday41
Thursday59
Friday50
  • (a) What is the total number of books borrowed in the week?
  • (b) On which day was the highest number of books borrowed?
▶️ Answer/Explanation

(a) Total = \( 48 + 52 + 41 + 59 + 50 = \boxed{250} \) books

(b) Highest number = 59 → Day: Thursday

Example :

The table shows the number of goals scored by a football team in five matches.

MatchGoals
12
23
31
44
50
  • (a) What is the average number of goals scored per match?
  • (b) In how many matches did the team score more than 2 goals?
▶️ Answer/Explanation

(a) Total goals = \( 2 + 3 + 1 + 4 + 0 = 10 \)
Average = \( \frac{10}{5} = \boxed{2} \) goals per match

(b) More than 2 goals in Match 2 and Match 4 → 2 matches

2. Interpreting Bar Charts and Pictograms

Bar charts and pictograms visually represent categorical data. Bar charts use rectangles to show frequency, while pictograms use pictures or symbols with a key. You may be asked to extract values, compare heights or frequencies, and interpret or estimate totals.

Example:

The bar chart shows the number of pets owned by students in a class.

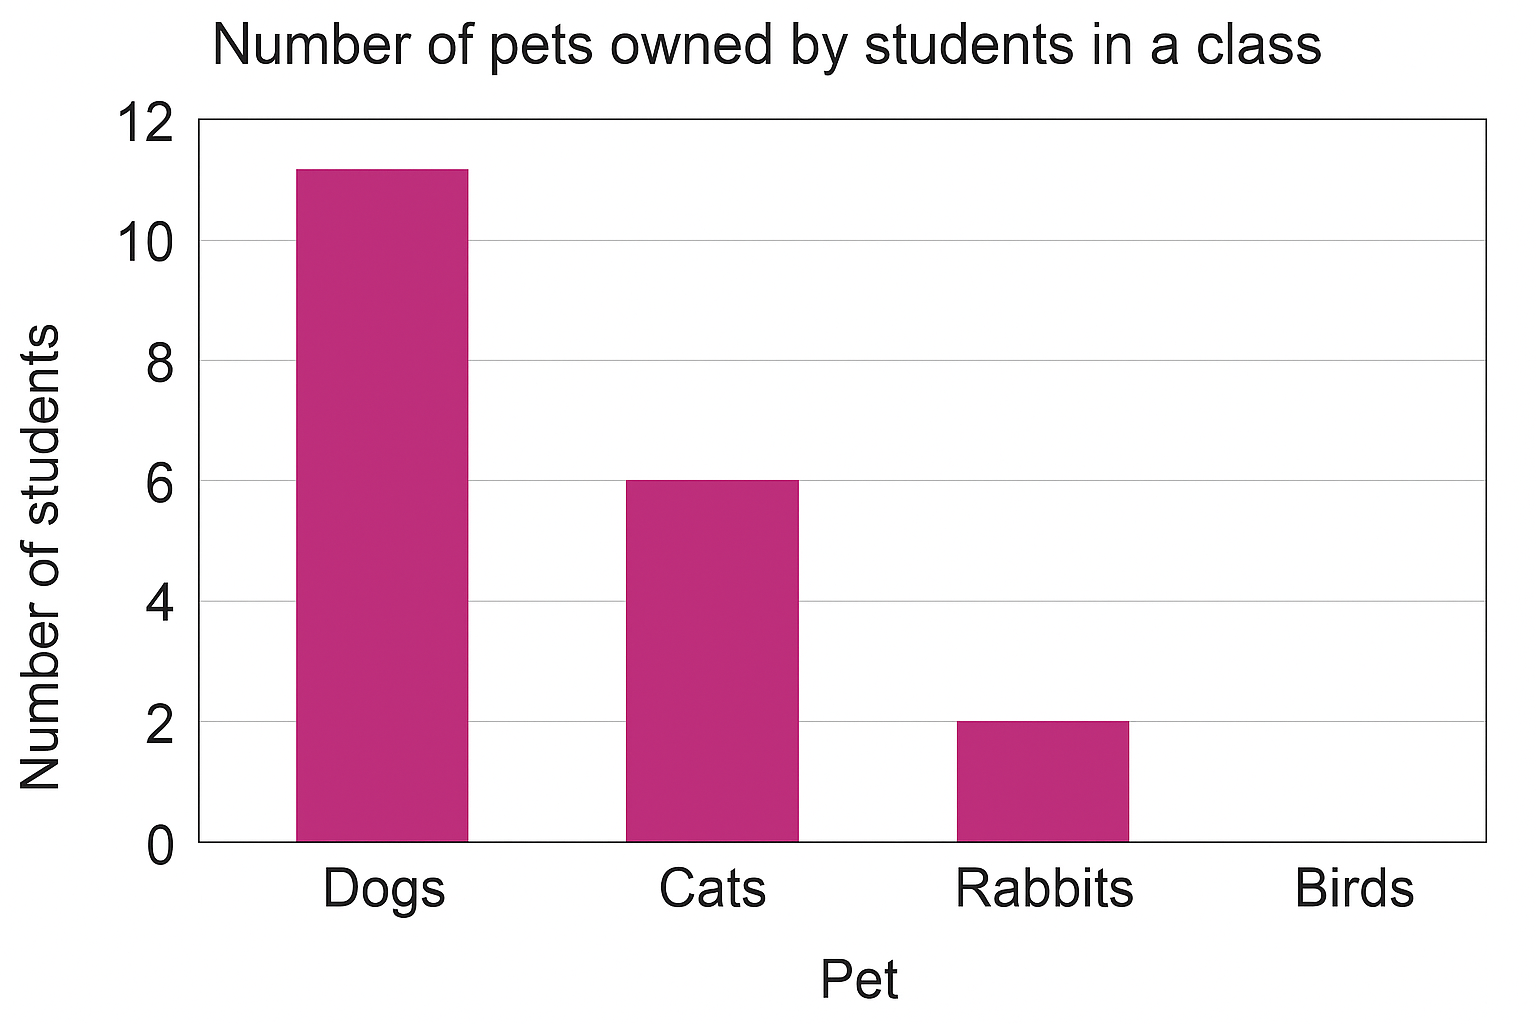
  • (a) How many students own cats?
  • (b) How many more students own dogs than rabbits?
▶️ Answer/Explanation

(a) From the bar chart, students owning cats = 6

(b) Students owning dogs = 11, rabbits = 2
Difference = \( 11 – 2 = \boxed{9} \)

Example:

The pictogram shows the number of cars sold by a showroom over 4 months.

  • (a) How many cars were sold in February?
  • (b) How many more cars were sold in March than in January?
▶️ Answer/Explanation

(a) February shows 4 full cars → \( 6 \times 10 = \boxed{60} \) cars

(b) March = 5 cars (50 cars), January = 5 cars (50 cars)
Difference = \( 50 – 50 = \boxed{00} \) cars

3. Interpreting Pie Charts and Line Graphs

Pie charts show how a total amount is divided into parts. Each sector’s angle represents a category’s proportion. Line graphs show trends or changes over time and are useful for identifying increases, decreases, and comparisons.

Example:

The pie chart shows how a student spends her day.

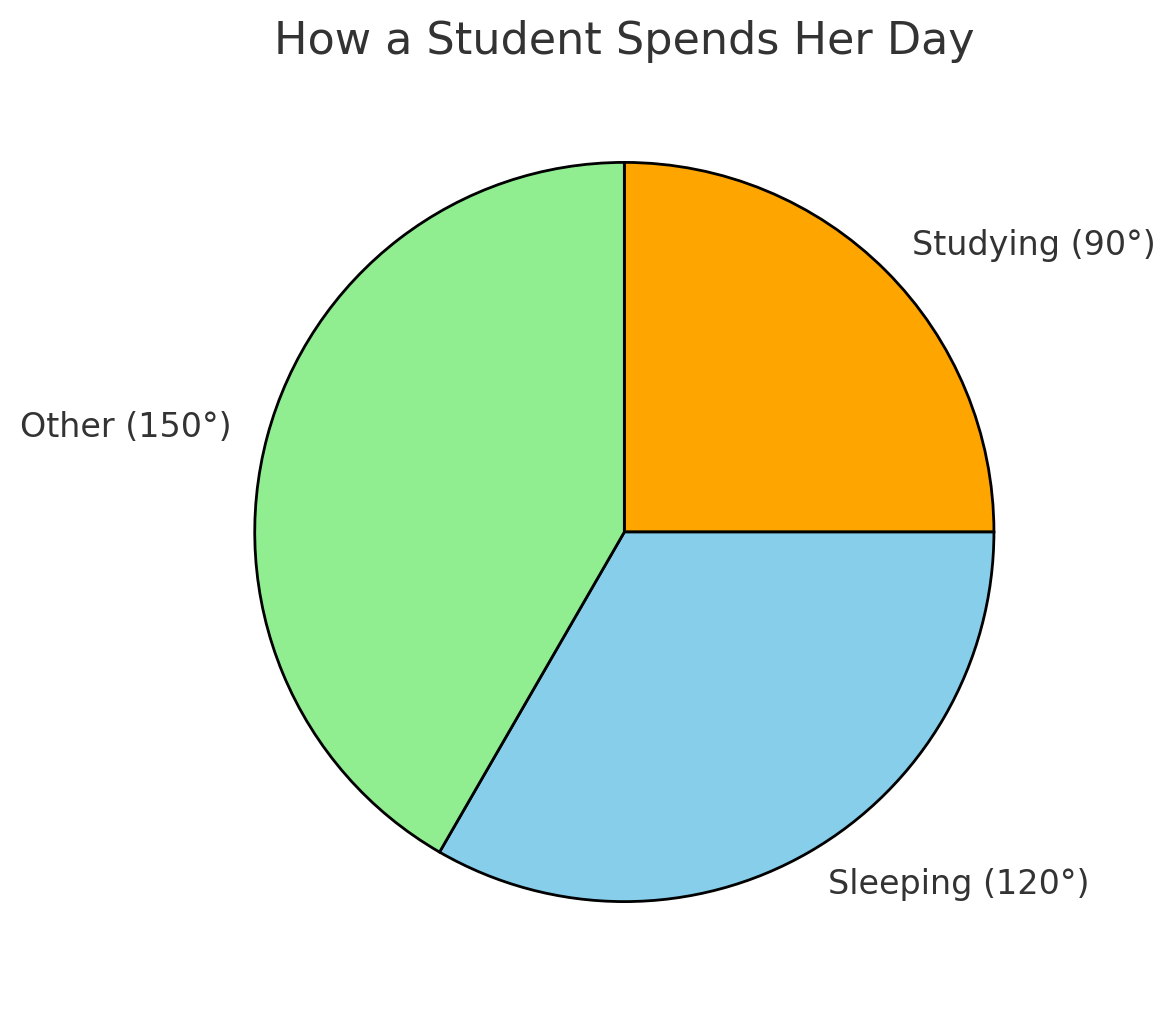
  • (a) What fraction of the day is spent studying?
  • (b) How many hours does she sleep if the total day is 24 hours?
▶️ Answer/Explanation

(a) Studying = 90° out of 360° → Fraction = \( \frac{90}{360} = \frac{1}{4} \)

(b) Sleeping = 120° → \( \frac{120}{360} \times 24 = \boxed{8} \) hours

Example:

The line graph shows the temperature at different times during a day.

  • (a) What was the temperature at 2 p.m.?
  • (b) During which time period did the temperature increase the fastest?
▶️ Answer/Explanation

(a) From the graph, at 2 p.m., temperature = 26°C

(b) The steepest increase is between 10 a.m. and 12 p.m.
Temperature rose from 18°C to 24°C → Increase of 6°C in 2 hours = fastest

Comparing Sets of Data

Comparing Sets of Data

We can compare two sets of data using:

  • Averages — mean, median, and mode
  • Spread — range or interquartile range (IQR)
  • Tables and graphs — like bar charts or line graphs

Comparing both the average and the spread gives a clearer idea of which group performed better and how consistent they were.

Example:

The table shows the scores of two classes in a math test out of 10. Find the mean for each class and compare the range.

ScoreClass A FrequencyClass B Frequency
532
653
765
846
924
▶️ Answer/Explanation

Step 1: Find the mean for each class

Class A: \( \frac{(5×3)+(6×5)+(7×6)+(8×4)+(9×2)}{3+5+6+4+2} = \frac{15+30+42+32+18}{20} = \frac{137}{20} = 6.85 \)

Class B: \( \frac{(5×2)+(6×3)+(7×5)+(8×6)+(9×4)}{2+3+5+6+4} = \frac{10+18+35+48+36}{20} = \frac{147}{20} = 7.35 \)

Step 2: Compare Range

Both classes have min = 5, max = 9 → Range = 4

Conclusion: Class B had a higher average score, but both classes had the same range.

Example:

Two cricket players, Arun and Bala, played 5 matches. Their scores are shown below: Find the mean for each class and compare the range.

MatchArunBala
14520
26035
33050
42565
54030
▶️ Answer/Explanation

Step 1: Find mean scores

Arun: \( \frac{45+60+30+25+40}{5} = \frac{200}{5} = 40 \)

Bala: \( \frac{20+35+50+65+30}{5} = \frac{200}{5} = 40 \)

Step 2: Compare spread (Range)

Arun: Max = 60, Min = 25 → Range = 35

Bala: Max = 65, Min = 20 → Range = 45

Conclusion: Both had the same average score, but Arun’s scores were more consistent (smaller range).

Understanding Limitations and Drawing Conclusions

Understanding Limitations and Drawing Conclusions

It is important to be cautious when interpreting statistical data. Not all data leads to reliable or valid conclusions.

  • Sample size: A small sample may not represent the whole population accurately.
  • Sampling method: If the sample is biased or not random, conclusions may be misleading.
  • Correlation vs. causation: A pattern between two variables does not mean one causes the other.
  • Missing data or incomplete information: This may lead to wrong or partial conclusions.
  • Generalisation: Be careful not to apply results too broadly without enough evidence.

Example:

A survey of 20 people in a gym showed that 85% of them eat protein bars. A newspaper claims: “Most people eat protein bars.” Is this a valid conclusion?

▶️ Answer/Explanation

Issue: The sample is taken only from a gym, where people are more likely to eat protein bars.

Conclusion: The sample is biased. It is not valid to generalise this result to the entire population.

Example:

 A study found a positive correlation between students’ shoe sizes and their reading ability. The school concludes that having bigger feet improves reading skills. Is this a correct interpretation?

▶️ Answer/Explanation

Issue: Correlation does not imply causation.

Reason: Older students tend to have bigger feet and also read better. Age is a hidden variable that influences both.

Conclusion: It is incorrect to conclude that shoe size causes better reading ability.

Scroll to Top