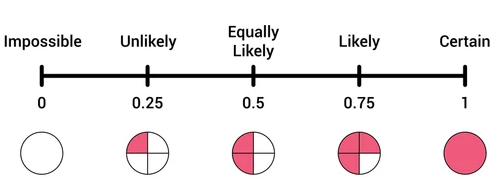
Understanding the Probability Scale (0 to 1)
Probability is a measure of how likely an event is to occur. It is always a number between 0 and 1.
- A probability of 0 means the event is impossible.
- A probability of 1 means the event is certain.
- A probability of 0.5 means the event is equally likely to happen or not happen.
Probabilities can also be expressed as fractions or percentages.
Example :
A coin is tossed. What is the probability of getting a head?
▶️ Answer/Explanation
There are two equally likely outcomes: Head or Tail.
\( \text{Probability of Head} = \dfrac{1}{2} = 0.5 \)
This lies exactly in the middle of the probability scale.
Example :
What is the probability of rolling a 7 on a standard six-sided die?
▶️ Answer/Explanation
The possible outcomes are: 1, 2, 3, 4, 5, 6.
Since 7 is not a possible outcome, the probability is:
\( \text{Probability} = 0 \)
This is an impossible event.
Example :
A bag contains only red balls. What is the probability of picking a red ball?
▶️ Answer/Explanation
Since all balls are red, picking a red ball is certain.
\( \text{Probability} = 1 \)
Calculating the Probability of a Single Event
To calculate the probability of a single event, use the formula:
\( P(\text{event}) = \dfrac{\text{number of favourable outcomes}}{\text{total number of possible outcomes}} \)
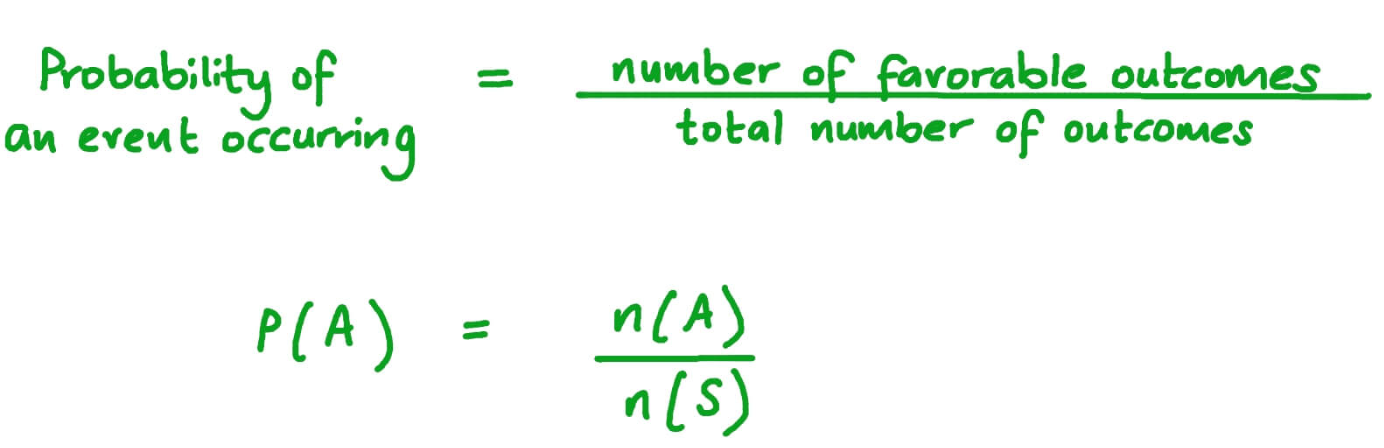
The answer can be written as a fraction, decimal, or percentage.
Example :
A bag contains 4 red balls, 3 blue balls and 5 green balls. What is the probability of picking a red ball?
▶️ Answer/Explanation
Total balls = 4 + 3 + 5 = 12
Favourable outcomes (red balls) = 4
\( P(\text{red}) = \dfrac{4}{12} = \dfrac{1}{3} = 0.333… \approx 33.3\% \)
Example :
The table shows the number of pets owned by 30 students:
| Pets | Number of Students |
|---|---|
| Dog | 12 |
| Cat | 8 |
| None | 10 |
What is the probability that a student chosen at random owns a cat?
▶️ Answer/Explanation
Total students = 30
Favourable outcomes = 8
\( P(\text{cat}) = \dfrac{8}{30} = \dfrac{4}{15} \approx 0.267 \approx 26.7\% \)
Example:
A class of 40 students were surveyed. The Venn diagram shows the number of students who like tea (T) and coffee (C)
What is the probability that a student chosen at random likes tea?
▶️ Answer/Explanation
Let’s say from the diagram:
- 10 like only tea
- 8 like both tea and coffee
- Total who like tea = 10 + 8 = 18
\( P(\text{tea}) = \dfrac{18}{40} = \dfrac{9}{20} = 0.45 = 45\% \)
Probability of an Event Not Occurring
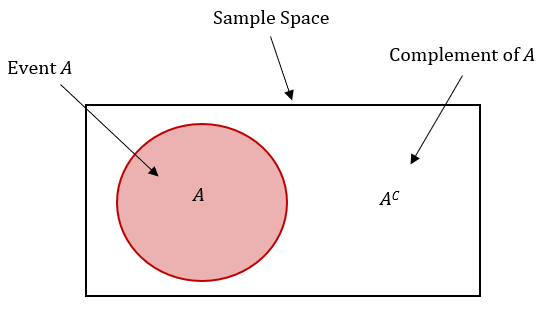
The probability of an event not happening is calculated by subtracting the probability of it happening from 1.
$ P(\text{not A}) = 1 – P(A)$
This is useful when it’s easier to find the probability of an event happening and subtract from 1.
Example:
A die is rolled. What is the probability of not rolling a 6?
▶️ Answer/Explanation
\( P(\text{rolling a 6}) = \dfrac{1}{6} \)
\( P(\text{not rolling a 6}) = 1 – \dfrac{1}{6} = \dfrac{5}{6} \)
Example:
The probability that a student walks to school is 0.7. What is the probability that the student does not walk to school?
▶️ Answer/Explanation
\( P(\text{not walking}) = 1 – 0.7 = 0.3 \)
Example:
In a survey of 80 students, 56 said they preferred science over humanities. What is the probability that a randomly chosen student does not prefer science?
▶️ Answer/Explanation
\( P(\text{prefers science}) = \dfrac{56}{80} = 0.7 \)
\( P(\text{does not prefer science}) = 1 – 0.7 = 0.3 = \dfrac{24}{80} = 30\% \)