Combined Events using Sample Space Diagrams
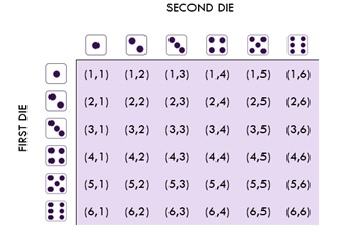
When two events happen in succession (e.g. rolling two dice, tossing two coins), we list all possible outcomes in a sample space diagram. It helps us calculate the probability of combined events — especially when the outcomes are equally likely.
Use this rule when outcomes are equally likely:
$ P(\text{Event}) = \dfrac{\text{Number of favourable outcomes}}{\text{Total number of outcomes}} $
Example:
Two 6-sided dice are rolled. What is the probability that the total score is 8?
▶️ Answer/Explanation
Total number of outcomes = \( 6 \times 6 = 36 \)
List outcomes that give a total of 8:
- (2,6), (3,5), (4,4), (5,3), (6,2) → 5 outcomes
\( P(\text{Total 8}) = \dfrac{5}{36} \)
Example:
Two coins are tossed. What is the probability of getting one head and one tail?
▶️ Answer/Explanation
Sample space: {HH, HT, TH, TT}
Favourable outcomes = HT, TH → 2 outcomes
Total outcomes = 4
\( P(\text{1 head, 1 tail}) = \dfrac{2}{4} = \dfrac{1}{2} \)
Example:
Two spinners each have numbers 1 to 4. What is the probability that the two numbers add up to more than 6?
▶️ Answer/Explanation
Total outcomes: \( 4 \times 4 = 16 \)
Favourable outcomes: (3,4), (4,3), (4,4)
Also: (2,5), (5,2) are invalid (spinner only goes up to 4)
Outcomes that sum to more than 6: (3,4), (4,3), (4,4) → 3 outcomes
\( P(\text{Sum > 6}) = \dfrac{3}{16} \)
Combined Events – Venn Diagrams
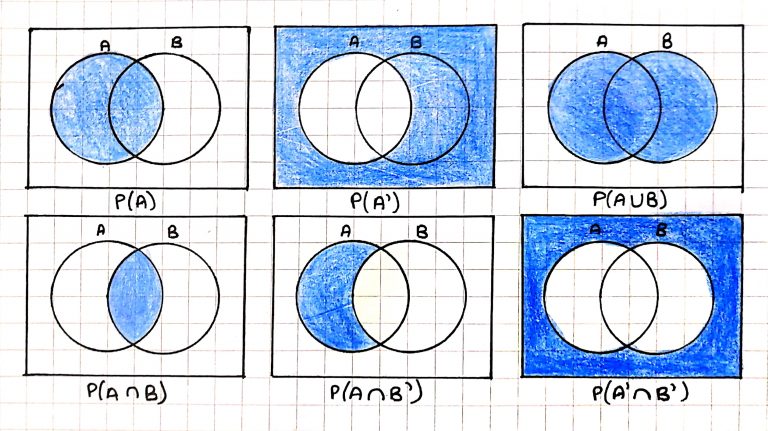
Venn diagrams visually represent relationships between different sets. They are useful for solving probability problems involving the union and intersection of events.
You should understand and use the following probability notation:
- P(A): Probability of event A occurring
- P(B): Probability of event B occurring
- P(A ∩ B): Probability of A and B both occurring (intersection)
- P(A ∪ B): Probability of A or B or both occurring (union)
- P(A’): Probability of A not occurring (complement)
- P(A’ ∩ B’) is neither A nor B so the outside
- P(A ∩ B’): is A and not B so all of A not containing B
When all values in a Venn diagram are known, use them to calculate required probabilities by:
$P(A \cup B) = P(A) + P(B) – P(A \cap B) $
Example :
In a group of 40 students:
- 22 study Maths (M)
- 18 study Science (S)
- 12 study both Maths and Science
Find: (a) \( P(M \cup S) \), (b) \( P(M \cap S) \), and (c) the number who study neither subject.
▶️ Answer/Explanation
Total students: 40
\( P(M \cap S) = \dfrac{12}{40} = 0.3 \)
\( P(M \cup S) = \dfrac{22 + 18 – 12}{40} = \dfrac{28}{40} = 0.7 \)
Number who study neither = 40 − 28 = 12 students
Example :
A Venn diagram shows:
- Set A has 10 elements
- Set B has 15 elements
- The intersection \( A \cap B \) has 5 elements
- Universal set has 25 elements
Find: (a) \( P(A \cup B) \), (b) number in \( A’ \cap B \)
▶️ Answer/Explanation
\( A \cup B = 10 + 15 – 5 = 20 \)
\( P(A \cup B) = \dfrac{20}{25} = 0.8 \)
\( A’ \cap B \) means: in B but not A = 15 − 5 = 10
So, answer is 10 elements
Combined Events –Tree Diagrams
Tree diagrams are used to represent all possible outcomes of one or more events, especially when events happen in succession. Each branch shows a possible outcome and its probability.

- Probabilities are written on the branches
- Outcomes are written at the end of branches
- To find the probability of a path, multiply the probabilities along the branches
- To find the probability of an event with multiple outcomes, add the probabilities of the paths
Example:
Draw a tree diagram to show all possible outcomes and find the probability of getting:
- (a) exactly one head
- (b) at least one tail
▶️ Answer/Explanation
Tree diagram:

(a) Exactly one head: HT or TH → \( P = \dfrac{1}{4} + \dfrac{1}{4} = \boxed{\dfrac{1}{2}} \)
(b) At least one tail: HT, TH, TT → \( P = \dfrac{1}{4} + \dfrac{1}{4} + \dfrac{1}{4} = \boxed{\dfrac{3}{4}} \)
Example:
A bag contains 3 red and 2 blue balls. Two balls are taken one after another without replacement. Find the probability that both balls are red.
▶️ Answer/Explanation
Tree Diagram:
- First pick: R (3/5), B (2/5)
- If R picked first: Second pick R (2/4), B (2/4)
- If B picked first: Second pick R (3/4), B (1/4)
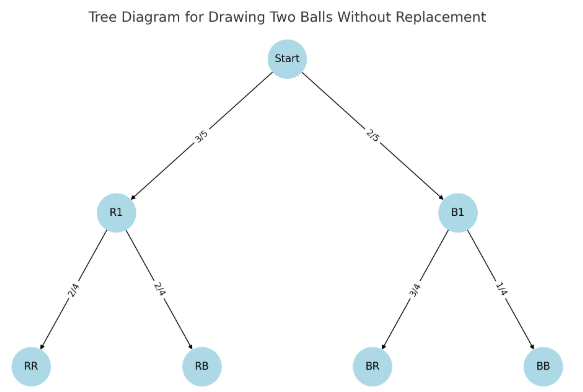
Required: P(R then R)
\( = \dfrac{3}{5} \times \dfrac{2}{4} = \dfrac{6}{20} = \boxed{\dfrac{3}{10}} \)