Sketching Curves
(a) Linear Graphs
Linear graphs are straight lines. The general form of a linear function is:
\( y = mx + c \)
- m is the gradient (slope) of the line.
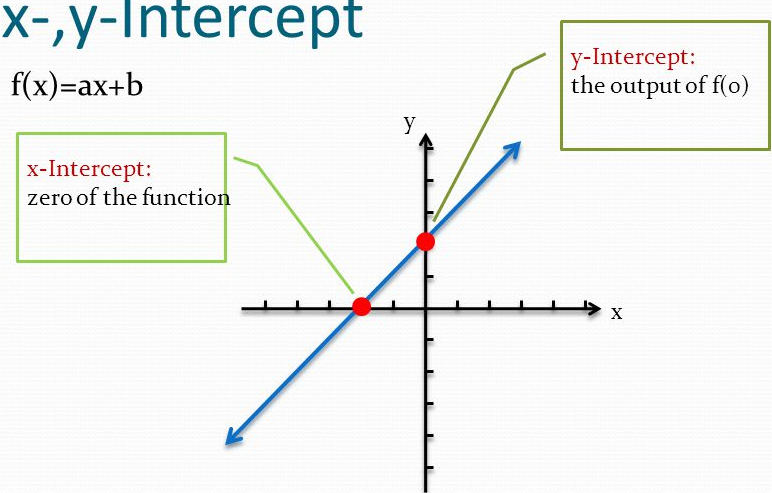
- c is the y-intercept (the point where the line crosses the y-axis).
To sketch a linear graph:
- Plot the y-intercept \( (0, c) \).
- Use the gradient to find another point (e.g., if \( m = 2 \), move up 2 units for every 1 unit across).
- Draw a straight line through the points.
Example :
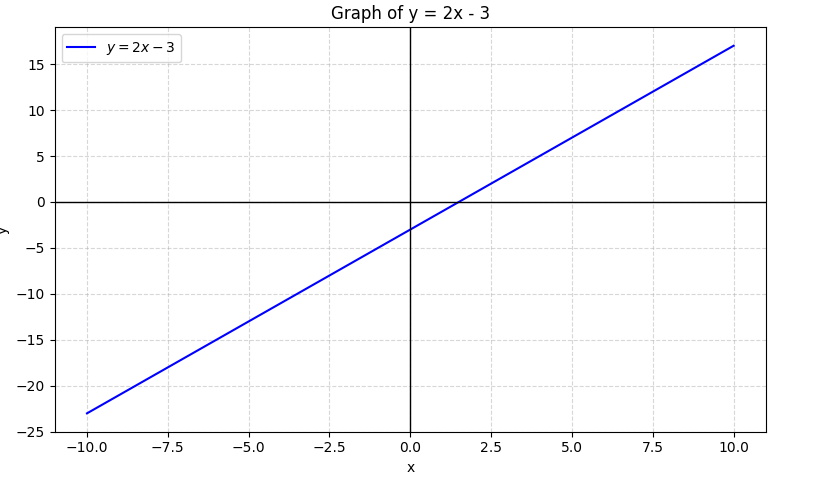
Sketch the graph of \( y = 2x – 3 \).
▶️ Answer/Explanation
Step 1: Identify gradient and intercept
- Gradient \( m = 2 \)
- Y-intercept \( c = -3 \), so the graph passes through \( (0, -3) \)
Step 2: Use gradient to find another point
- From \( (0, -3) \), go up 2 units and right 1 unit → \( (1, -1) \)
Step 3: Plot the two points and draw a straight line through them
- You may also plot a third point for accuracy: try \( x = 2 \):
- \( y = 2(2) – 3 = 1 \) → point \( (2, 1) \)
Line passes through: (0, -3), (1, -1), and (2, 1)
(b) Quadratic Graphs
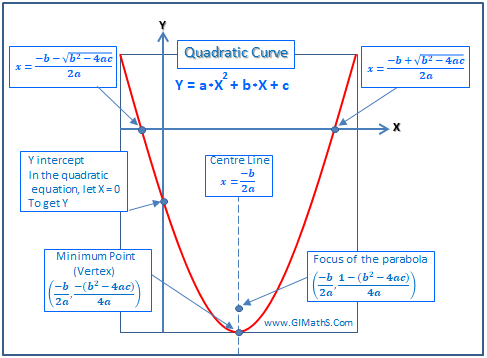
Quadratic graphs are parabolas. The general form is:
\( y = ax^2 + bx + c \)
- If \( a > 0 \), the parabola opens upward.
- If \( a < 0 \), it opens downward.
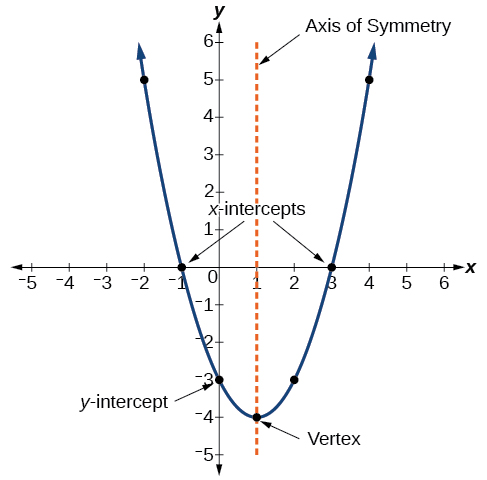
- The graph is symmetric about a vertical line called the axis of symmetry.
Key Features to Sketch a Quadratic:
- Roots (x-intercepts): Solve \( y = 0 \). These are the points where the graph crosses the x-axis.
- y-intercept: Set \( x = 0 \) to find \( y = c \).
- Axis of symmetry: Given by \( x = -\frac{b}{2a} \).
- Vertex: The turning point of the parabola, lies on the axis of symmetry. Find its coordinates using substitution into the original equation.

To sketch:
- Find the roots (if factorable or by using the quadratic formula).
- Identify the y-intercept.
- Find the axis of symmetry and the vertex.
- Plot these key points and draw a smooth curve.
Tip:
- A sketch shows shape and key features (roots, y-intercept, vertex), not exact points.
- Use symmetry to plot mirrored points on either side of the vertex.
Example :
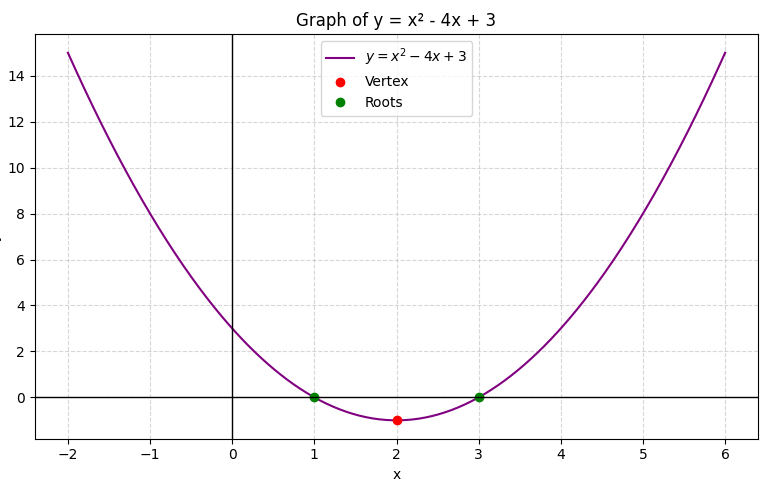
Sketch the graph of \( y = x^2 – 4x + 3 \).
▶️ Answer/Explanation
Step 1: Factorise to find roots
- \( y = (x – 1)(x – 3) \)
- So the graph crosses the x-axis at \( x = 1 \) and \( x = 3 \)
Step 2: Find y-intercept
- Set \( x = 0 \): \( y = 0^2 – 4(0) + 3 = 3 \)
- So it crosses the y-axis at \( (0, 3) \)
Step 3: Find axis of symmetry
- Using \( x = -\frac{b}{2a} = -\frac{-4}{2(1)} = 2 \)
- This is the line of symmetry.
Step 4: Find the vertex
- Substitute \( x = 2 \): \( y = (2)^2 – 4(2) + 3 = 4 – 8 + 3 = -1 \)
- Vertex is at \( (2, -1) \)
Summary of key points:
- Roots: \( (1, 0) \), \( (3, 0) \)
- Y-intercept: \( (0, 3) \)
- Vertex: \( (2, -1) \)
- Axis of symmetry: \( x = 2 \)
Sketch a symmetrical U-shaped curve through these points.
(c) Cubic Graphs
Cubic graphs have the general form:
\( y = ax^3 + bx^2 + cx + d \)
- If \( a > 0 \), the curve rises to the right.
- If \( a < 0 \), the curve falls to the right.
- Cubic graphs may have 1 or 3 real roots (x-intercepts).
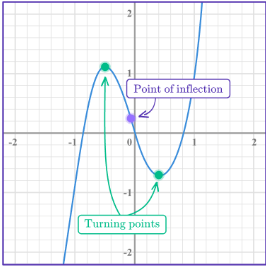
They often have an S-shaped curve (if 3 real roots exist), with a turning point (maximum or minimum) and a point of inflection.
Example :
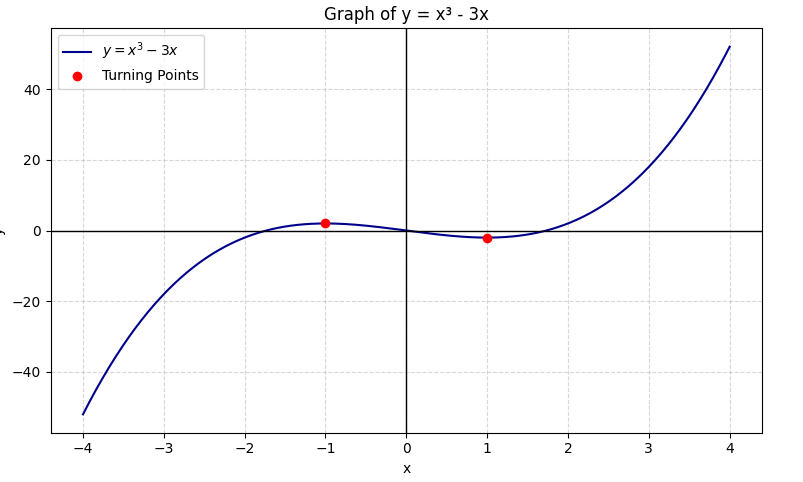
Sketch the graph of \( y = x^3 – 3x \).
▶️ Answer/Explanation
Step 1: Factorise
\( y = x(x^2 – 3) = x(x – \sqrt{3})(x + \sqrt{3}) \)
Roots: \( x = 0, \pm\sqrt{3} \)
Step 2: Turning Point (approx)
The curve turns between the roots and has a point of inflection at \( x = 0 \)
Sketch: S-shaped graph passing through origin and symmetric around origin.
(d) Reciprocal Graphs
The reciprocal graph is of the form:
\( y = \frac{1}{x} \)
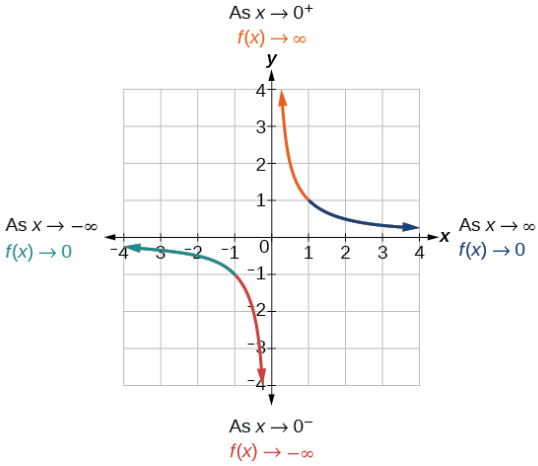
- The graph has two branches (in opposite quadrants).
- There is a vertical asymptote at \( x = 0 \) and a horizontal asymptote at \( y = 0 \).
- The graph never touches the axes.
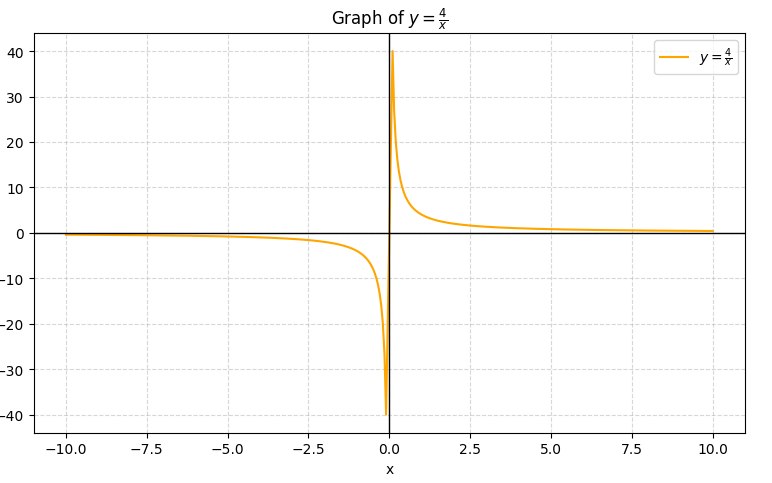
Example :
Sketch the graph of \( y = \frac{4}{x} \).
▶️ Answer/Explanation
Key points:
- When \( x = 1 \), \( y = 4 \)
- When \( x = -1 \), \( y = -4 \)
- When \( x = 2 \), \( y = 2 \)
- When \( x = -2 \), \( y = -2 \)
Asymptotes: The curve gets closer to x-axis and y-axis but never touches them.
(e) Exponential Graphs
Exponential graphs have the form:
\( y = ab^x \), where \( b > 0 \) and \( b \neq 1 \)
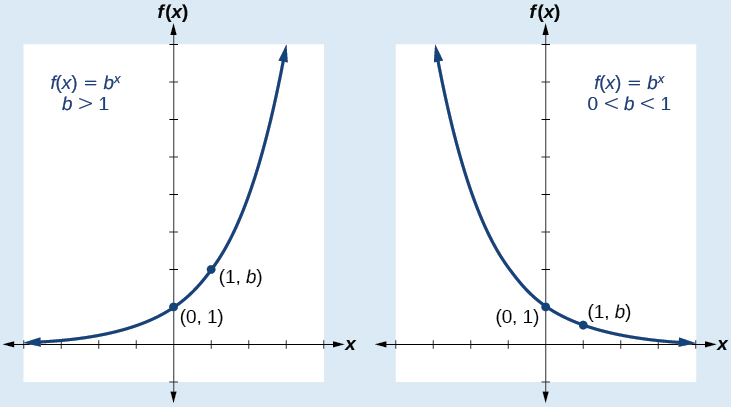
- If \( b > 1 \), the graph shows exponential growth.
- If \( 0 < b < 1 \), the graph shows exponential decay.
- There is a horizontal asymptote at \( y = 0 \).
Example :
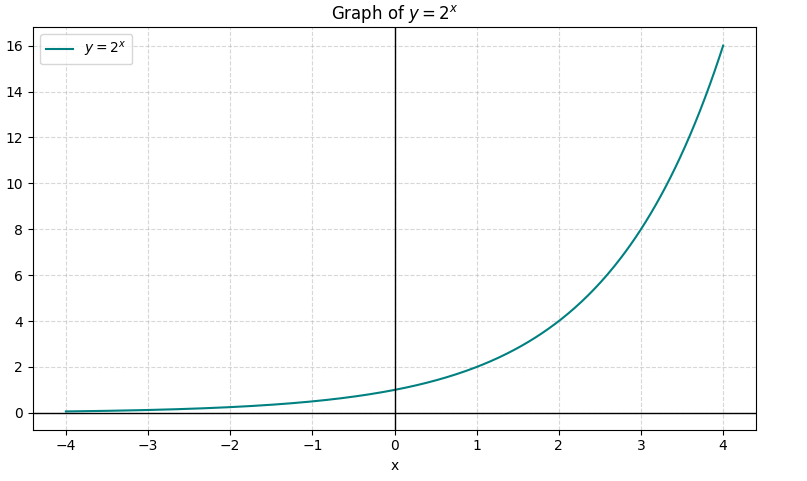
Sketch the graph of \( y = 2^x \).
▶️ Answer/Explanation
Key points:
- When \( x = 0 \), \( y = 1 \)
- When \( x = 1 \), \( y = 2 \)
- When \( x = 2 \), \( y = 4 \)
- When \( x = -1 \), \( y = 0.5 \)
- As \( x \to -\infty \), \( y \to 0 \) (asymptote)
The curve starts close to the x-axis (left side) and rises steeply to the right.