Question
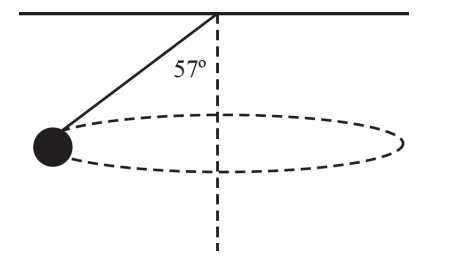
A conical pendulum is hanging from a string that is 2.2 meters long. It makes a horizontal circle. The mass of the ball at the end of the string is 0.5 kg.
(a) Below, make a free-body diagram for the ball at the point shown in the above illustration. Label each force with an appropriate letter.

(b) Write out Newton’s Second Law in both the x- and y-direction in terms used in your free-body diagram.
(c) Calculate the centripetal acceleration from your free-body diagram.
(d) What is the radius of the circle that the ball is traveling in?
(e) What is the speed of the ball?
▶️Answer/Explanation
Ans:
(a) A free-body diagram would include only the tensions in the string and the force of gravity as shown below. Because the pendulum makes a horizontal circle, take some care to draw the direction of the force represented by the tension along the path of the string.
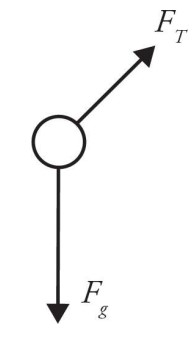
(b) Where θ is the angle between \(F_{T}\) and the normal,
\(\Sigma F_{x}=ma_{x}\)
\(F_{T}\sin \theta =ma_{x}\) AND
\(\Sigma F_{Y}=ma_{y}\)
\(F_{T}\cos \theta -F_{g}=ma_{y}\)
(c) The centripetal force is the net force in the x-direction. However, you need to use some information from the y-direction. Because the conical pendulum travels in a horizontal circle, there is no acceleration in the y-direction and so Newton’s Second Law in the y-direction becomes
\(F_{T}\cos \theta -F_{g}=0\) OR
\(F_{T}\cos \theta =F_{g}\)
\(F_{T}=\frac{F_{g}}{\cos \theta }\)
\(F_{T}=\frac{0.5kg(10m/s^{2})}{\cos57^{\circ}}\)
\(F_{T}=9.2N\)
(d) The radius the ball travels can be found using some geometry. The length of the string is 2.2 m at an angle of 57 degrees. This means
\(\sin \theta =\frac{opp}{hyp}\)
\(\sin57^{\circ}=\frac{r}{2.2m}\)
\(r=1.84m\) 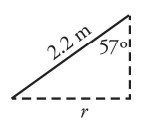
(e) The ball will travel at a speed of
\(a_{c}=\frac{v^{2}}{r}\)
\(v^{2}=a_{c}r\)
\(v=\sqrt{15.4m/s^{2}}\times1.84m\)
\(v=5.32m/s^{2}\)
Question
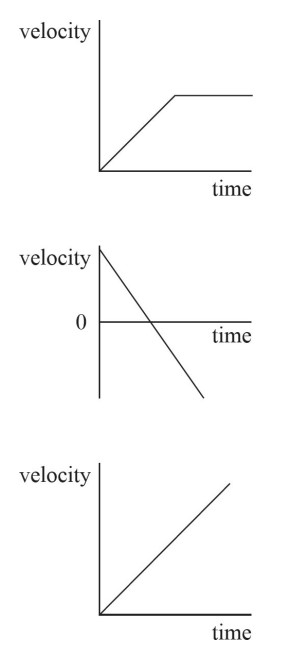
The three graphs above depict the velocity of different objects as functions of time. Given that information, draw displacement vs. time and acceleration vs. time graphs for each of them. Additionally, give an example of a situation that could produce each of the three graphs above.
▶️Answer/Explanation
Ans:
The other two graphs for the first situation would look like this:
 These graphs could be made from a car or plane accelerating up to a certain speed and then maintaining it.
The next set of graphs should look like this:
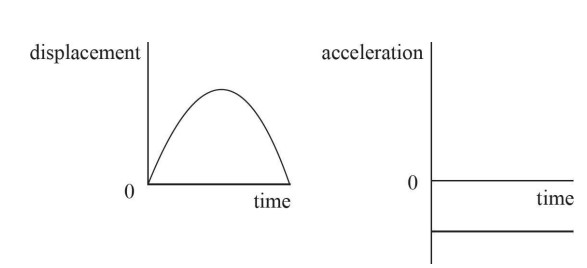
These could be made from any case of ideal projectile motion.
The final set would look like this:

These could be made from an object undergoing uniform accelerated motion.
