Ecosystem: Patterns, Components, Productivity, and Decomposition
🔬 What is an Ecosystem?
Definition: An ecosystem is the interaction between living organisms (biotic) and their non-living environment (abiotic).
It includes organisms, their physical environment, and interactions that sustain energy flow and nutrient cycling.
Functionally, all ecosystems work as a unit through:
- Productivity (biomass generation)
- Decomposition (recycling of nutrients)
- Energy flow
- Nutrient cycling
🌿 Components of an Ecosystem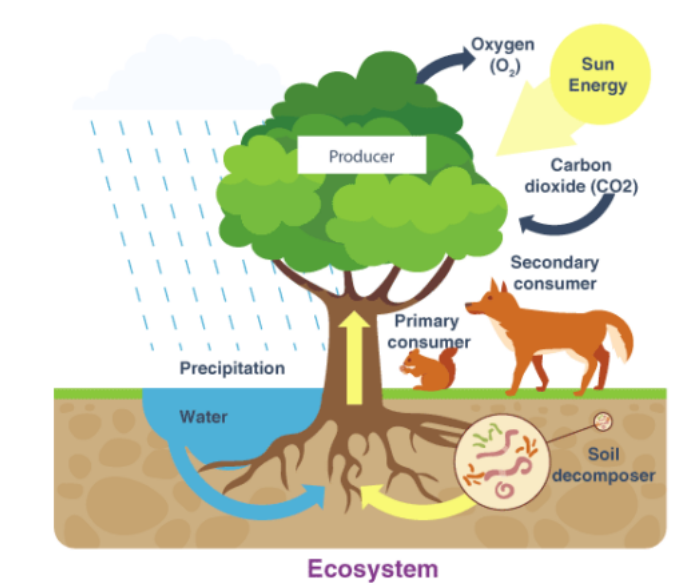
1. Abiotic Components
Non-living chemical and physical factors influencing life.
- Sunlight: Provides energy for photosynthesis.
- Temperature: Regulates metabolic and physiological activities.
- Water: Essential for survival, photosynthesis, and nutrient transport.
- Soil: Provides minerals, water retention, and anchorage.
- Role: Sets the framework for species distribution and productivity.
2. Biotic Components
Living organisms classified based on trophic levels:
| Category | Role | Example |
|---|---|---|
| Producers (Autotrophs) | Convert inorganic to organic matter via photosynthesis | Phytoplankton, algae, terrestrial plants |
| Consumers (Heterotrophs) | Feed on producers or other consumers | Zooplankton, herbivores, carnivores |
| Decomposers | Break down dead organic matter to inorganic nutrients | Bacteria, fungi, earthworms |
3. Species Composition & Stratification
- Species composition: Identification of plant and animal species in an ecosystem.
- Stratification: Vertical distribution of species across different levels (canopy, understory, ground layer).
🌎 Example: Pond Ecosystem
- Abiotic: Water, minerals, sunlight, temperature, sediment at the bottom.
- Producers: Phytoplankton, algae, emergent and submerged plants.
- Consumers: Zooplankton, small fish, insects, benthic animals.
- Decomposers: Bacteria and fungi at the bottom.
Function:
- Photosynthesis by autotrophs converts inorganic substances to organic matter.
- Heterotrophs consume producers.
- Decomposers recycle nutrients back to autotrophs.
- Energy flows unidirectionally up the trophic levels, with loss as heat.
⚡ Productivity in Ecosystems
1. Primary Productivity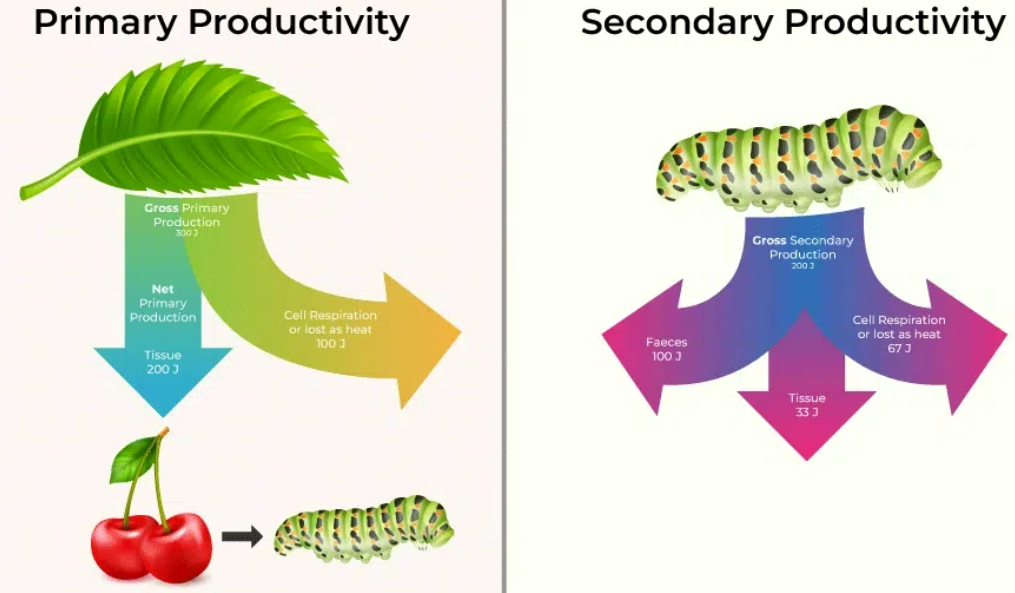
Definition: Rate of biomass production by plants per unit area per unit time.
Units: g/m² or kcal/m²
- Gross Primary Productivity (GPP): Total organic matter produced via photosynthesis.
- Net Primary Productivity (NPP): Organic matter remaining after plant respiration.
- Formula:
\( \mathrm{NPP} = \mathrm{GPP} – \mathrm{Respiration} (R) \) - Significance: NPP represents biomass available to herbivores and decomposers.
2. Secondary Productivity
Definition: Rate of biomass production by consumers (herbivores, carnivores).
Represents energy transfer efficiency between trophic levels.
🔄 Decomposition
Definition: Breakdown of dead organic matter into inorganic substances by decomposers.
Importance: Recycles nutrients, maintains soil fertility, and sustains ecosystem productivity.
1. Steps in Decomposition
| Step | Process | Role / Example |
|---|---|---|
| Fragmentation | Detritivores (earthworms) break debris into smaller particles | Improves soil aeration |
| Leaching | Water-soluble inorganic nutrients move into soil layers | Makes nutrients accessible to plants |
| Catabolism | Microbial enzymes degrade complex organics to simpler compounds | Release of CO₂, NH₄⁺, minerals |
| Humification | Formation of humus (dark, amorphous organic matter) | Nutrient reservoir, slow decay, colloidal nature |
| Mineralization | Breakdown of humus to inorganic nutrients | Recycled back to autotrophs |
2. Factors Affecting Decomposition
| Factor | Effect |
|---|---|
| Oxygen | Aerobic conditions favor faster decomposition |
| Detritus composition | Lignin/chitin-rich → slow; sugar/nitrogen-rich → fast |
| Temperature & Moisture | Warm, moist → rapid; dry/cold → slow |
| Anaerobic conditions | Slows decomposition |
Example: Earthworm is called “farmer’s friend” → loosens soil, improves aeration, and aids nutrient cycling.
📝 Quick Recap
– Ecosystem: Interaction between biotic and abiotic components.
– Abiotic: Sunlight, temperature, water, soil
– Biotic: Producers, consumers, decomposers
– Primary Productivity: \( \mathrm{NPP} = \mathrm{GPP} – \mathrm{R} \)
– Secondary Productivity: Biomass generated by consumers
– Decomposition: Fragmentation → Leaching → Catabolism → Humification → Mineralization
– Factors: Oxygen, detritus type, temperature, moisture, aerobic/anaerobic
– Mnemonic: “Producers Consume, Decomposers Recycle Nutrients”
Energy Flow in Ecosystems
🌱 Introduction
Energy is the driving force of ecosystems.
All living organisms require energy to survive, grow, and reproduce.
Source of energy: Sun → captured by producers (autotrophs) via photosynthesis.
Energy flows unidirectionally from one trophic level to the next, unlike nutrients which cycle.
Energy is eventually lost as heat due to metabolic processes (Second Law of Thermodynamics).
🧬 Trophic Levels
Definition: Trophic levels are the hierarchical positions organisms occupy in a food chain based on energy flow and feeding relationships.
| Trophic Level | Function | Example |
|---|---|---|
| Producers (Autotrophs) | Convert solar energy into chemical energy via photosynthesis | Phytoplankton, algae, grass, trees |
| Primary Consumers (Herbivores) | Feed on producers | Grasshopper, rabbit, zooplankton |
| Secondary Consumers (Carnivores) | Feed on herbivores | Frog, snake, small fish |
| Tertiary Consumers (Top Carnivores) | Feed on secondary consumers | Hawk, tiger, shark |
| Decomposers (Saprotrophs) | Break down dead matter → recycle nutrients | Bacteria, fungi, earthworms |
🔄 Food Chain and Food Web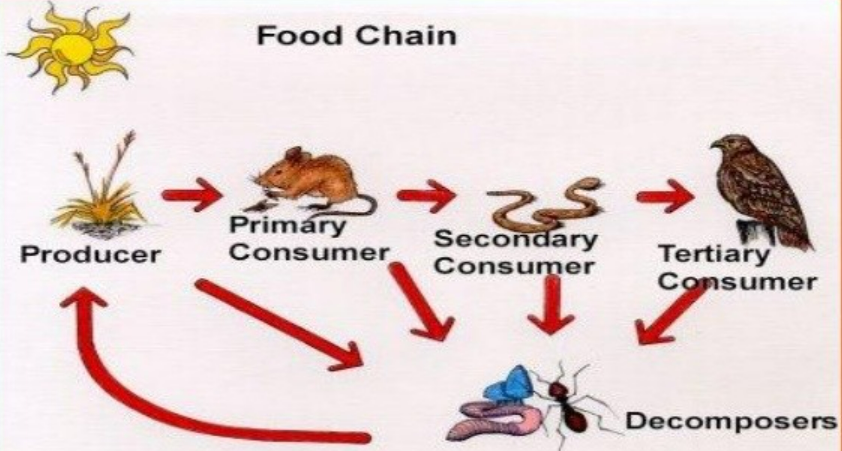
1. Food Chain
Simple linear sequence showing who eats whom.
- Grazing food chain: Starts with green plants → herbivores → carnivores.
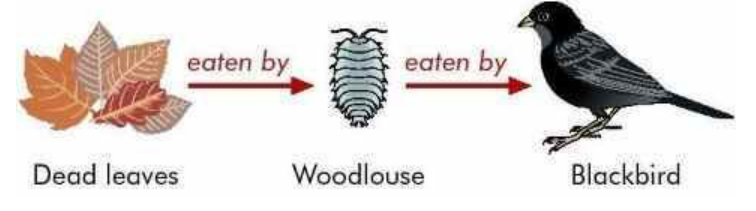
Example: Grass → Grasshopper → Frog → Snake → Hawk - Detritus food chain: Starts with dead organic matter → detritivores → decomposers → carnivores.

Example: Dead leaves → Earthworms → Beetles → Birds
2. Food Web
Network of interlinked food chains showing complex feeding relationships in an ecosystem.
Provides stability: If one species is lost, energy can still flow through alternate pathways.
📊 Energy Flow Principles
Unidirectional Flow: Sun → producers → consumers → decomposers. Energy cannot be recycled.
Energy Loss: At each trophic level, 10% of energy is transferred to the next level (Lindeman’s 10% law).
Remaining 90% is lost as heat via respiration, feces, and metabolic processes.
Pyramids of Energy
Graphical representation of energy at each trophic level. Always upright because energy decreases at higher levels.
| Level | Energy % | Example |
|---|---|---|
| Producers | 100% | Grass |
| Primary consumers | 10% | Grasshopper |
| Secondary consumers | 1% | Frog |
| Tertiary consumers | 0.1% | Snake |
Observation: Only a small fraction of energy reaches top carnivores → limits number of trophic levels in an ecosystem.
🌿 Productivity and Energy Flow
- Gross Primary Productivity (GPP): Total energy captured by producers.
- Net Primary Productivity (NPP): Energy available to herbivores.
\( \mathrm{NPP} = \mathrm{GPP} – \mathrm{Respiration\ by\ producers\ (R)} \) - Secondary productivity: Energy accumulated by consumers.
- Tertiary productivity: Energy accumulated by carnivores.
- Energy Transfer Efficiency:
\( \mathrm{Efficiency} = \frac{\text{Energy at higher trophic level}}{\text{Energy at lower trophic level}} \times 100 \)
Usually ~10% between successive levels.
🔹 Detritus and Energy Recycling
- Decomposers (bacteria, fungi) recycle energy and nutrients from dead organisms.
- Energy is not recycled, but nutrients like N, P, C are returned to soil → used by producers.
- Detritus-based food chains are important in forests and aquatic ecosystems.
🖼 Example: Pond Ecosystem Energy Flow
- Producers: Phytoplankton, algae
- Primary consumers: Zooplankton, insects
- Secondary consumers: Small fish
- Tertiary consumers: Large fish, birds
- Decomposers: Bacteria, fungi
Energy Flow Path:
Sun → Phytoplankton (Producers) → Zooplankton (Primary) → Small Fish (Secondary) → Large Fish/Birds (Tertiary) → Decomposers
Energy decreases at each level → explains why top predators are fewer.
🔹 Key Points
- Energy flows, does not cycle in ecosystems.
- Only ~10% energy is transferred to the next trophic level.
- Energy loss limits number of trophic levels.
- Producers are the foundation of all energy flow.
- Decomposers are essential for nutrient recycling but not energy recycling.
📝 Quick Recap
– Source of energy: Sun → captured by producers → flows through consumers → lost as heat.
– Trophic levels: Producers → Herbivores → Carnivores → Top carnivores → Decomposers
– Energy transfer: 10% from one level to next (Lindeman’s Law)
– Pyramids of energy: Always upright
– Food chains: Grazing & detritus
– Food webs: Interlinked chains → ecosystem stability
– Detritus role: Recycles nutrients for producers
– Mnemonic: “Sun Produces Energy, Herbivores Consume, Carnivores Top, Decomposers Recycle”
Pyramids in Ecology
🌱 Introduction
Ecological pyramids are graphical representations of the trophic structure of an ecosystem.
They show the relationship between different trophic levels in terms of:
Number of organisms → Pyramid of Numbers
Amount of living matter (biomass) → Pyramid of Biomass
Energy content → Pyramid of Energy
Pyramids help in understanding energy flow and ecosystem structure.
1. Pyramid of Numbers
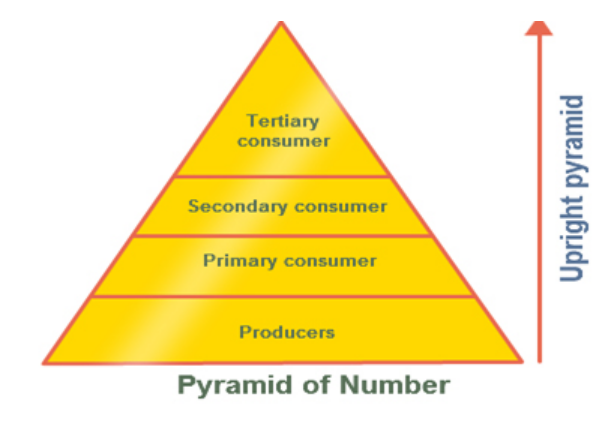
Definition: Shows the number of organisms at each trophic level in an ecosystem.
Key Points:
- Units: Number of individuals
- Usually upright, but can be inverted in special cases
| Ecosystem Type | Shape of Pyramid | Reason |
|---|---|---|
| Grassland | Upright | Many producers support fewer herbivores and even fewer carnivores |
| Tree-based forest | Inverted | One large tree supports hundreds of herbivores (e.g., insects) |
Observation: Does not account for size or biomass of organisms → limitation.
2. Pyramid of Biomass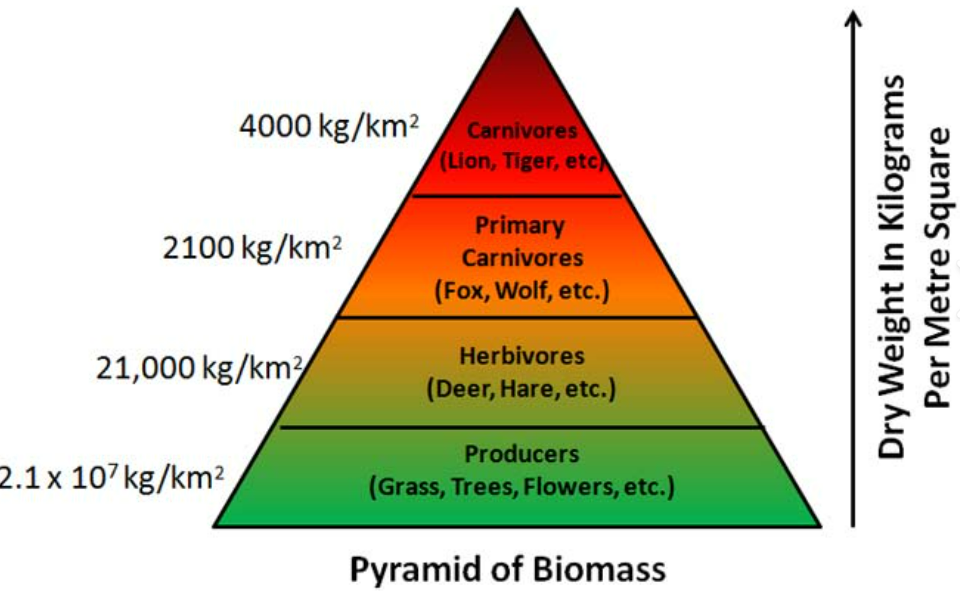
Definition: Represents the total dry weight of living organisms at each trophic level.
- Units: g/m² or kg/m²
- Usually upright: producers have the largest biomass, top carnivores have the least.
- Can be inverted in aquatic ecosystems: Small phytoplankton have low biomass but high productivity and support large biomass of zooplankton.
| Trophic Level | Biomass (kg/m²) | Observation |
|---|---|---|
| Producers | 10 | Phytoplankton (small biomass in water, high productivity) |
| Primary consumers | 50 | Zooplankton (high biomass) |
| Secondary consumers | 5 | Small fish |
| Tertiary consumers | 1 | Large fish |
Note: Inverted pyramid of biomass is typical of lakes and oceans.
3. Pyramid of Energy
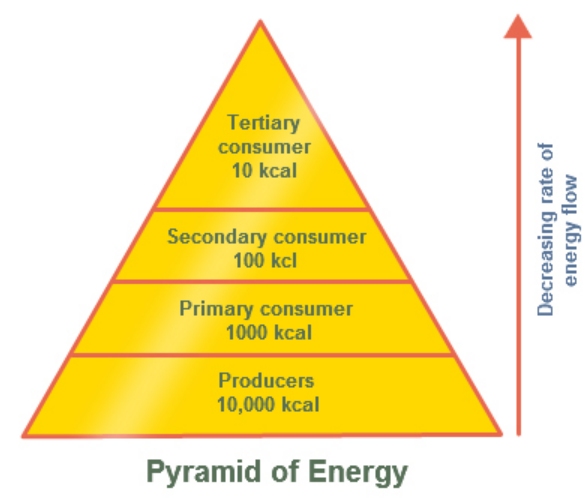
Definition: Shows energy content at each trophic level over a given time.
- Units: kcal/m²/year or kJ/m²/year
- Always upright → energy decreases from producers → top carnivores.
- Accounts for productivity, not just biomass or number.
- Explains why ecosystems cannot support too many trophic levels.
| Trophic Level | Energy (kcal/m²/year) |
|---|---|
| Producers | 10000 |
| Primary consumers | 1000 |
| Secondary consumers | 100 |
| Tertiary consumers | 10 |
Observation: Follows Lindeman’s 10% law → only ~10% energy transfers to the next trophic level.
🔹 Comparison Table: Number, Biomass, Energy
| Feature | Pyramid of Number | Pyramid of Biomass | Pyramid of Energy |
|---|---|---|---|
| Measures | Number of organisms | Total dry weight | Energy content over time |
| Units | Number of individuals | g/m² or kg/m² | kcal/m²/year or kJ/m²/year |
| Usually | Upright | Upright | Upright |
| Can be inverted? | Yes (tree ecosystems) | Yes (aquatic ecosystems) | No |
| Represents | Structure of population | Standing crop | Energy flow through trophic levels |
| Limitation | Ignores size/biomass | Ignores energy content | Complex to measure |
⚡ Quick Points
- Number pyramid: Shows population count → can be inverted in trees.
- Biomass pyramid: Shows mass → inverted in aquatic ecosystems.
- Energy pyramid: Shows energy → always upright, reflects productivity and energy loss.
- Reason for upright energy pyramid: Energy flows unidirectionally and is lost as heat at each level.
📝 Quick Recap
– Pyramids show trophic structure and energy flow.
– Number: Count of organisms → can invert.
– Biomass: Dry weight → can invert (phytoplankton → zooplankton).
– Energy: Energy content → always upright (10% law).
– Energy decreases with higher trophic levels → limits top predators.
– Mnemonic: “Number sometimes flips, Biomass can dip, Energy always slips”