Respiration: Exchange of Gases in Plants
🌱 Introduction
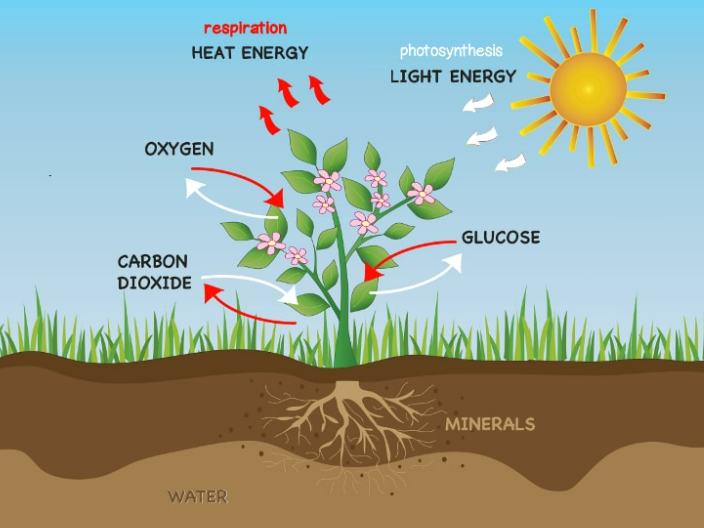
Respiration in plants involves uptake of oxygen (O2) and release of carbon dioxide (CO2).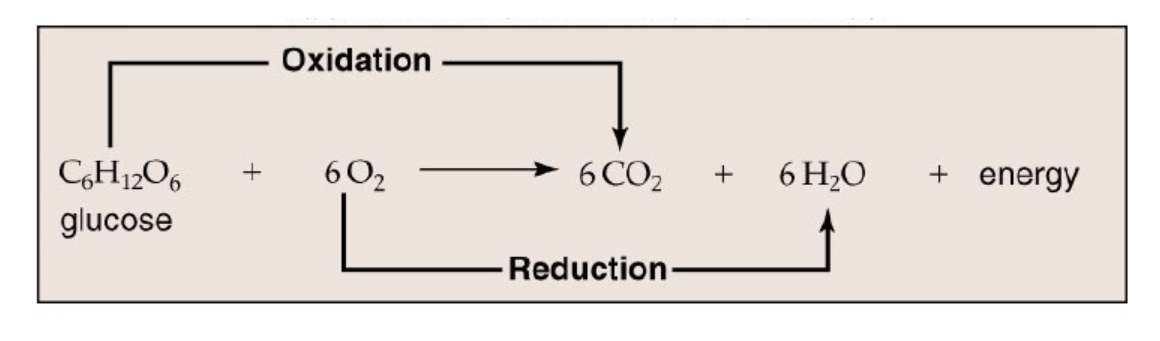
This gas exchange is essential for cellular respiration, which produces ATP required for growth, active transport, and biosynthesis.
- O2 → used to oxidize glucose in mitochondria
- CO2 → released as a byproduct of respiration (glycolysis, Krebs cycle)
Even though plants photosynthesize during the day, they respire continuously, day and night.
🔆 1. Pathways of Gas Exchange
Plants have special structures and mechanisms to facilitate the exchange of gases:
A. Stomata
- Found on leaves (mostly lower epidermis)
- Pores surrounded by guard cells

- Allow O2 out and CO2 in
- Open during the day → photosynthesis and gas exchange
- Close in darkness or drought → reduces water loss, but respiration still occurs using internal O2
B. Lenticels
- Found in stems and roots of woody plants
- Loosely arranged cork cells → porous
- Allow diffusion of O2 into tissues and CO2 out
C. Aerenchyma (in aquatic plants)
- Spongy tissue with large air spaces
- Helps O2 diffusion to submerged tissues
- Enables plants like water lilies and hydrophytes to respire underwater
🔗 2. Mechanism of Gas Exchange
Diffusion: Main mechanism
Gases move from high concentration → low concentration:
- O2 moves into cells (where it’s lower)
- CO2 moves out of cells (where it accumulates during respiration)
Factors affecting diffusion:
- Surface area – more stomata/lenticels → faster exchange
- Concentration gradient – higher difference → faster diffusion
- Temperature – higher temp → faster diffusion
- Water availability – excessive water can block lenticels; drought closes stomata
⚡ 3. Day vs Night Gas Exchange
| Time | Oxygen (O2) | Carbon Dioxide (CO2) | Process |
|---|---|---|---|
| Day | Consumed for respiration | Released from respiration | Photosynthesis also uses CO2 and releases O2, so net effect depends on balance |
| Night | Consumed for respiration | Released from respiration | Only respiration occurs (no photosynthesis) |
Note: Plants produce oxygen during the day due to photosynthesis, but they consume oxygen all the time for cellular respiration.
🌟 4. Special Adaptations in Plants
| Plant Type | Adaptation | Function |
|---|---|---|
| Woody plants | Lenticels | Allow O2 to penetrate thick bark |
| Aquatic plants | Aerenchyma | Facilitates O2 transport to submerged roots |
| Desert plants | CAM stomata (night opening) | Minimize water loss but allow gas exchange at night |
📦 Quick Recap
Respiration = O2 uptake + CO2 release
Gas exchange structures: Stomata (leaves), Lenticels (stems), Aerenchyma (aquatic plants)
Diffusion is the main mechanism; depends on gradient, surface area, temperature, water
Day vs Night: O2 consumed always; CO2 release occurs during respiration
Adaptations: Lenticels, aerenchyma, CAM stomata help optimize gas exchange in special conditions
Cellular Respiration in Plants
🌱 Introduction
Cellular respiration is a catabolic process in which plants break down organic molecules (like glucose) to release energy in the form of ATP.
- Aerobic respiration: Requires O2, produces maximum ATP
- Anaerobic respiration (Fermentation): Occurs in absence of O2, produces less ATP
Overall Reaction (Aerobic Respiration):
C6H12O6 + 6 O2 → 6 CO2 + 6 H2O + Energy (ATP)
The main stages:
- Glycolysis (cytoplasm)
- Fermentation (anaerobic)
- Tricarboxylic Acid (TCA) Cycle / Krebs Cycle (mitochondrial matrix)
- Electron Transport Chain (ETC) & Oxidative Phosphorylation (inner mitochondrial membrane)
1. Glycolysis (EMP Pathway)
Location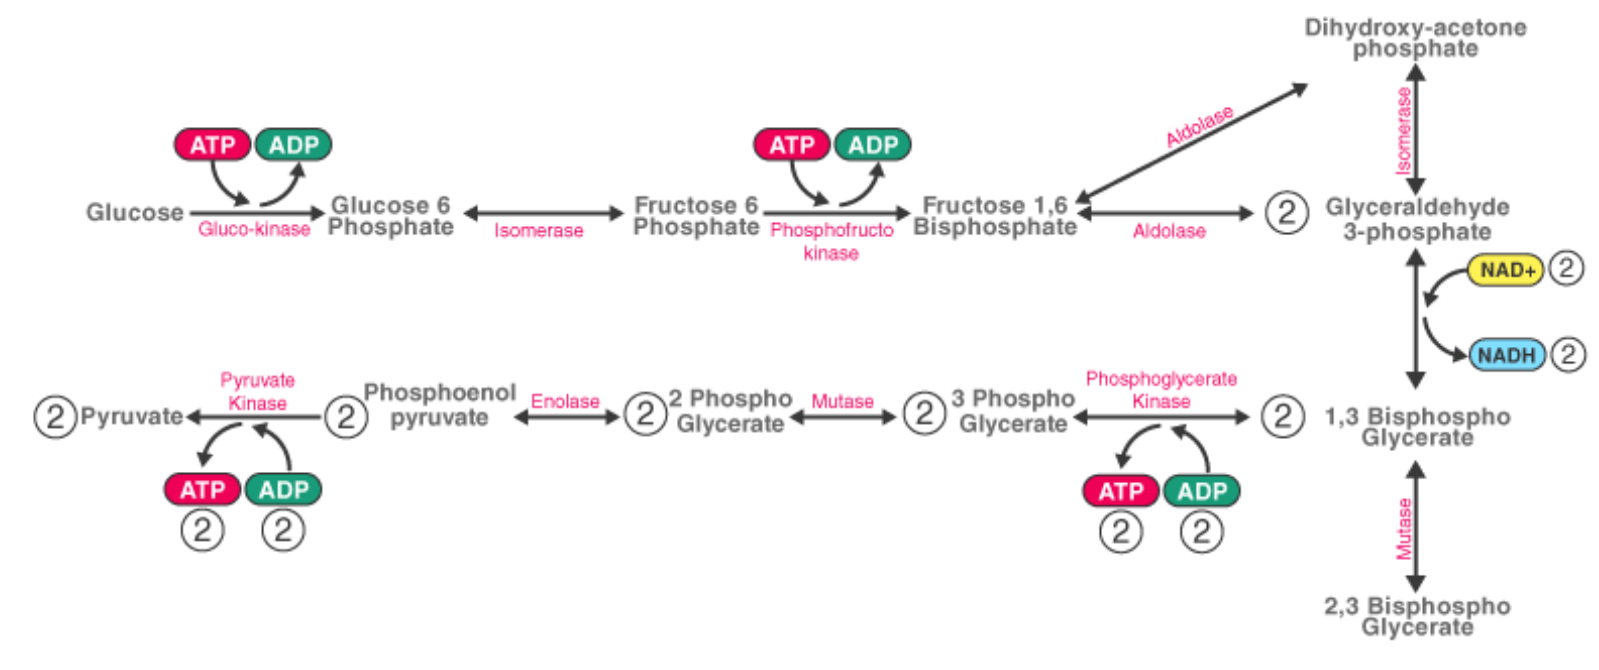
- Cytoplasm of the cell
- Anaerobic, occurs in all cells
Key Features
- Glucose (6C) → 2 Pyruvate (3C each)
- ATP produced: Net 2 ATP per glucose
- NADH produced: 2 NADH per glucose
Steps
- Glucose → Glucose-6-phosphate (Hexokinase, uses 1 ATP)
- Glucose-6-phosphate → Fructose-6-phosphate (Phosphoglucose isomerase)
- Fructose-6-phosphate → Fructose-1,6-bisphosphate (Phosphofructokinase, uses 1 ATP)
- Fructose-1,6-bisphosphate → DHAP + G3P (Aldolase)
- G3P → 1,3-Bisphosphoglycerate (Glyceraldehyde-3-phosphate dehydrogenase → NADH)
- 1,3-BPG → 3-Phosphoglycerate (Phosphoglycerate kinase → 2 ATP)
- 3-Phosphoglycerate → 2-Phosphoglycerate (Phosphoglycerate mutase)
- 2-Phosphoglycerate → Phosphoenolpyruvate (PEP) (Enolase)
- PEP → Pyruvate (Pyruvate kinase → 2 ATP)
Significance
- Produces ATP and NADH
- Provides pyruvate for aerobic respiration (Krebs cycle) or fermentation
2. Fermentation (Anaerobic Respiration)
Occurs when oxygen is absent. Glucose is partially oxidized.
🌟 Types
A. Alcoholic Fermentation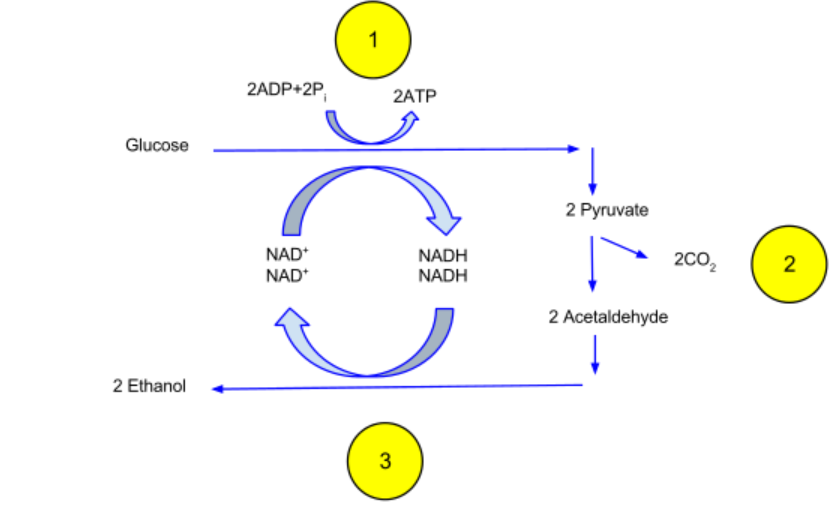
- Occurs in plants and yeasts
- Pyruvate → Ethanol + CO2
- Enzymes: Pyruvate decarboxylase → Alcohol dehydrogenase
- ATP yield: 2 ATP (from glycolysis)
- Used in: Alcohol, bread, and fermentation industries
B. Lactic Acid Fermentation
- Occurs in muscles (animals) and some bacteria
- Pyruvate → Lactic acid
- ATP yield: 2 ATP
- Types: Homolactic (only lactic acid), Heterolactic (lactic acid + ethanol + CO2)
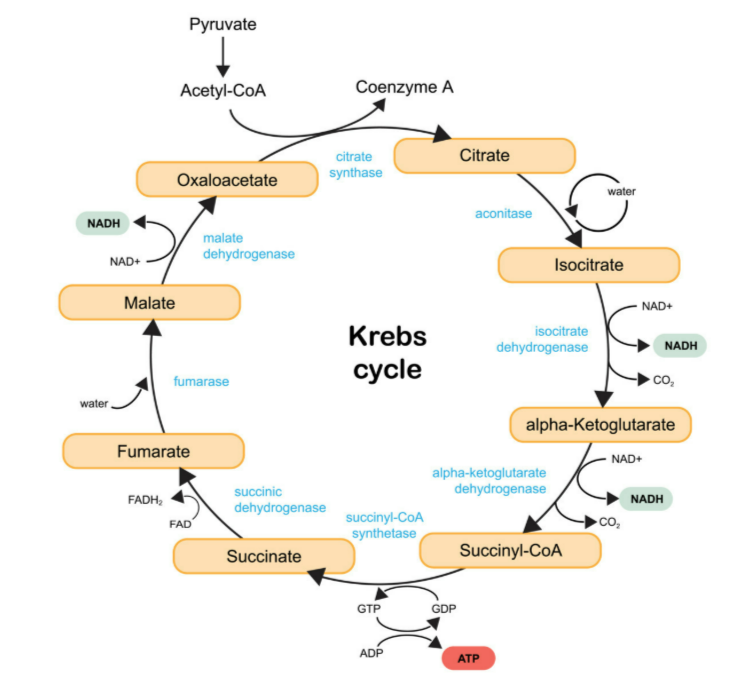
3. Tricarboxylic Acid (TCA) / Krebs Cycle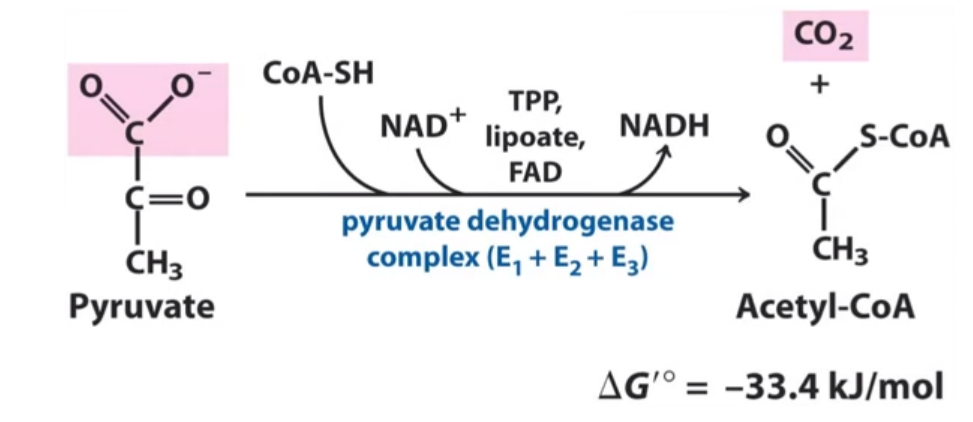
Location
- Mitochondrial matrix
Key Features
- Pyruvate → Acetyl-CoA (via pyruvate dehydrogenase complex)
- Acetyl-CoA + Oxaloacetate → Citrate → Cycle continues
 Acetyl-CoA + Oxaloacetate → Citrate → Cycle continues
Steps
- Acetyl-CoA + Oxaloacetate → Citrate (Citrate synthase)
- Citrate → Isocitrate (Aconitase)
- Isocitrate → α-Ketoglutarate + CO2 + NADH (Isocitrate dehydrogenase)
- α-Ketoglutarate → Succinyl-CoA + CO2 + NADH (α-Ketoglutarate dehydrogenase)
- Succinyl-CoA → Succinate + GTP (Substrate-level phosphorylation)
- Succinate → Fumarate + FADH2 (Succinate dehydrogenase)
- Fumarate → Malate (Fumarase)
- Malate → Oxaloacetate + NADH (Malate dehydrogenase)
Products per Acetyl-CoA
| Molecule | Amount |
|---|---|
| NADH | 3 |
| FADH2 | 1 |
| GTP/ATP | 1 |
| CO2 | 2 |
Total for 1 glucose: Multiply by 2 (from 2 pyruvate)
4. Electron Transport Chain (ETC) & Oxidative Phosphorylation
Location
- Inner mitochondrial membrane
Key Features
- Electrons from NADH and FADH2 → passed through electron carriers
- Final electron acceptor = Oxygen → forms H2O
- Energy released pumps protons into intermembrane space → creates proton gradient
- Protons flow back through ATP synthase (F0-F1 complex) → ATP formed
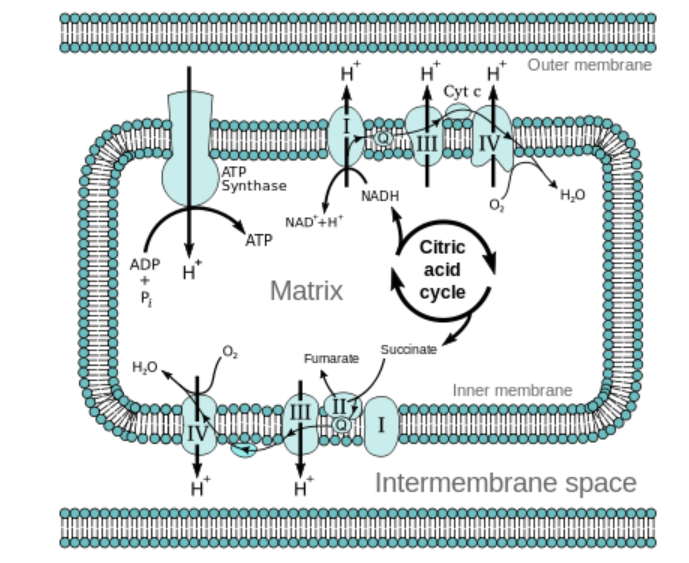
Electron Flow
- NADH → Complex I (NADH dehydrogenase) → Ubiquinone
- FADH2 → Complex II (Succinate dehydrogenase) → Ubiquinone
- Ubiquinone → Complex III (Cytochrome bc1) → Cytochrome c
- Cytochrome c → Complex IV (Cytochrome oxidase) → O2 reduced to H2O
ATP Yield
- NADH → 3 ATP
- FADH2 → 2 ATP
- Total per glucose: ~34 ATP (ETC + oxidative phosphorylation)
5. Significance of Respiration
- Energy production: ATP used for growth, active transport, biosynthesis
- Amphibolic pathway: Intermediates used for anabolism (e.g., amino acids, fatty acids)
- Interconnection: Links glycolysis, fermentation, TCA, and ETC for efficient energy use
6. Respiratory Quotient (RQ)
Definition: Ratio of CO2 released to O2 consumed
\[
\text{RQ} = \frac{\text{Volume of } \ce{CO2} \text{ evolved}}{\text{Volume of } \ce{O2} \text{ consumed}}
\]
RQ = Volume of CO2 evolved / Volume of O2 consumed
| Substrate | RQ |
|---|---|
| Carbohydrates | 1 |
| Fats | 0.7 |
| Proteins | 0.8 |
7. Factors Affecting Respiration in Plants
| Factor | Effect |
|---|---|
| Temperature | Optimum temp → max respiration; high temp → enzyme denaturation |
| Oxygen | Low O2 → anaerobic respiration increases |
| CO2 | Excess CO2 → slight inhibition |
| Inhibitors | Cyanide, azide → block ETC |
| Age | Young, growing cells → higher respiration rate |
📦 Quick Recap
Glycolysis: Glucose → 2 Pyruvate + 2 ATP + 2 NADH (cytoplasm)
Fermentation: Anaerobic → Ethanol + CO2 / Lactic acid + 2 ATP
TCA/Krebs Cycle: Pyruvate → Acetyl-CoA → CO2 + NADH + FADH2 + GTP (mitochondrial matrix)
ETC & Oxidative Phosphorylation: NADH/FADH2 → O2 → H2O + ATP (~34 ATP per glucose)
RQ: Ratio CO2/O2 → indicates substrate type
Factors: Temperature, O2, inhibitors, plant age
Energy Relations in Cellular Respiration
🌱 Introduction
Cellular respiration is the process by which plants (and all living organisms) release energy from organic molecules like glucose. This energy is stored in the form of ATP, which is the energy currency of the cell.
ATP is used for biosynthesis, active transport, growth, and other metabolic processes.
Different stages of respiration generate different amounts of ATP.
Energy yield depends on substrate type (glucose, fats, proteins) and respiration pathway (aerobic or anaerobic).
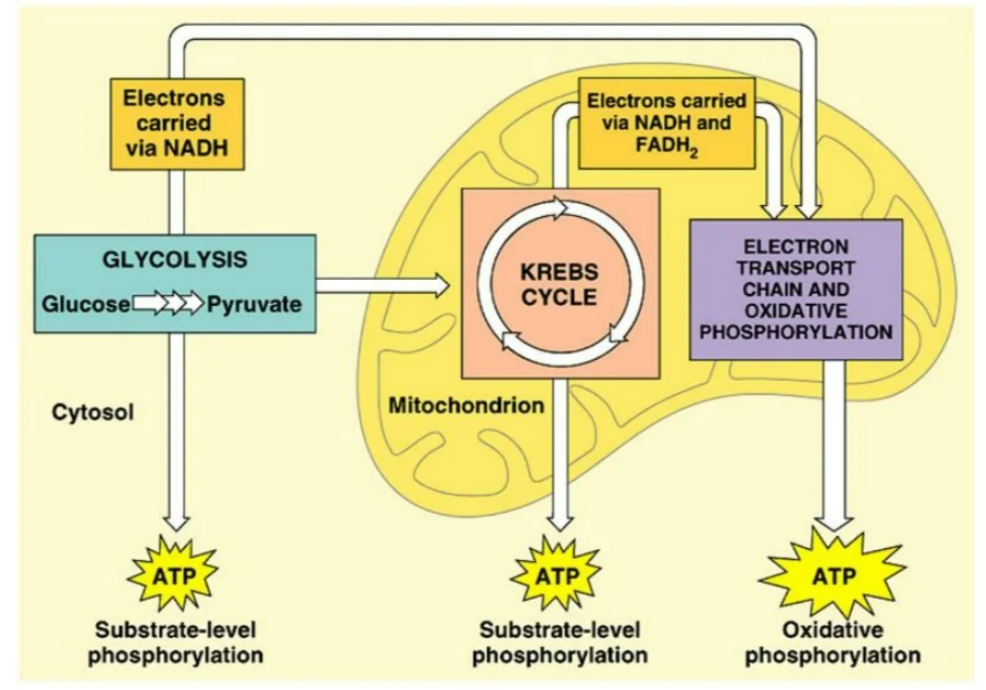
1. ATP Production in Different Stages of Respiration
| Stage | Location | Products per Glucose | ATP Yield |
|---|---|---|---|
| Glycolysis | Cytoplasm | 2 Pyruvate, 2 NADH | 2 ATP (net) + 2 NADH → 6 ATP (via ETC) |
| Pyruvate → Acetyl-CoA | Mitochondrial matrix | 2 NADH per glucose | 6 ATP (3 per NADH) |
| TCA / Krebs Cycle | Mitochondrial matrix | 6 NADH, 2 FADH2, 2 GTP/ATP | 18 ATP (from NADH) + 4 ATP (2 FADH2 ×2) + 2 GTP ≈ 24 ATP |
| ETC & Oxidative Phosphorylation | Inner mitochondrial membrane | NADH & FADH2 electrons → O2 → H2O | Included in above calculation; drives ATP synthesis (~34 ATP total) |
| Fermentation (anaerobic) | Cytoplasm | 2 ATP per glucose (from glycolysis only) | No additional ATP; low energy yield |
Note: Exact ATP yield may vary slightly in plants due to proton leakage and shuttle mechanisms.
2. Overall ATP Yield in Aerobic Respiration of Glucose
- Glycolysis: 2 ATP (net) directly + 2 NADH → 6 ATP in mitochondria
- Pyruvate → Acetyl-CoA: 2 NADH → 6 ATP
- Krebs Cycle (2 Acetyl-CoA): 6 NADH → 18 ATP; 2 FADH2 → 4 ATP; 2 GTP → 2 ATP
- Total ATP from 1 glucose molecule (theoretical): 2 + 6 + 6 + 18 + 4 + 2 = 38 ATP
- Practical yield in plant cells may be ~36 ATP due to energy cost of transporting NADH from cytoplasm to mitochondria
3. ATP Yield in Anaerobic Respiration (Fermentation)
| Type | Product | ATP Yield |
|---|---|---|
| Alcoholic fermentation | Ethanol + CO2 | 2 ATP (from glycolysis only) |
| Lactic acid fermentation | Lactate | 2 ATP (from glycolysis only) |
Anaerobic pathways produce far less energy than aerobic respiration.
4. Energy Summary of Respiratory Pathways
| Pathway | Location | Oxygen Required | ATP Yield per Glucose | Notes |
|---|---|---|---|---|
| Glycolysis | Cytoplasm | No | 2 ATP + 2 NADH → 6 ATP | Anaerobic step, universal |
| Fermentation | Cytoplasm | No | 2 ATP | Regenerates NAD+ for glycolysis |
| Pyruvate → Acetyl-CoA | Mitochondria | Yes | 2 NADH → 6 ATP | Links glycolysis to TCA |
| Krebs Cycle | Mitochondrial matrix | Yes | 24 ATP (6 NADH + 2 FADH2 + 2 GTP) | Main site of electron carriers |
| ETC + Oxidative Phosphorylation | Inner mitochondrial membrane | Yes | ~34 ATP | Uses NADH & FADH2 to make ATP |
Key Insight: Aerobic respiration produces 18-19 times more ATP than anaerobic respiration.
5. Factors Affecting ATP Yield
- Oxygen availability – Anaerobic conditions reduce ATP to 2 per glucose
- Temperature – Enzyme activity affects glycolysis, TCA, and ETC
- Substrate type – Fats and proteins yield more ATP than glucose (fatty acids → many acetyl-CoA units)
- Transport costs – Moving NADH from cytoplasm to mitochondria may reduce total ATP
6. Significance of ATP Production
- Supports biosynthesis of carbohydrates, proteins, nucleic acids, and lipids
- Powers active transport across membranes
- Drives cell division, growth, and differentiation
- Provides energy for stress responses and defense mechanisms
📦 Quick Recap
Aerobic respiration: 1 glucose → ~36-38 ATP
Anaerobic fermentation: 1 glucose → 2 ATP
Main ATP sources:
Glycolysis → 2 ATP (substrate level) + 2 NADH → 6 ATP
Pyruvate → Acetyl-CoA → 2 NADH → 6 ATP
Krebs cycle → 6 NADH + 2 FADH2 + 2 GTP → 24 ATP
ETC & Oxidative phosphorylation: Uses proton gradient to convert NADH/FADH2 into ATP
Efficiency: Aerobic >> Anaerobic (~18× more energy)
Amphibolic Pathways in Plants
🌱 Introduction
An amphibolic pathway is a metabolic pathway that serves both catabolic and anabolic functions.
- Catabolic role: Breaks down molecules to release energy
- Anabolic role: Provides intermediates for biosynthesis of important biomolecules
Respiration in plants is amphibolic, linking energy production with biosynthesis.
In simple words: the same pathway can release energy and also supply building blocks for growth.
🔆 Examples of Amphibolic Pathways in Plants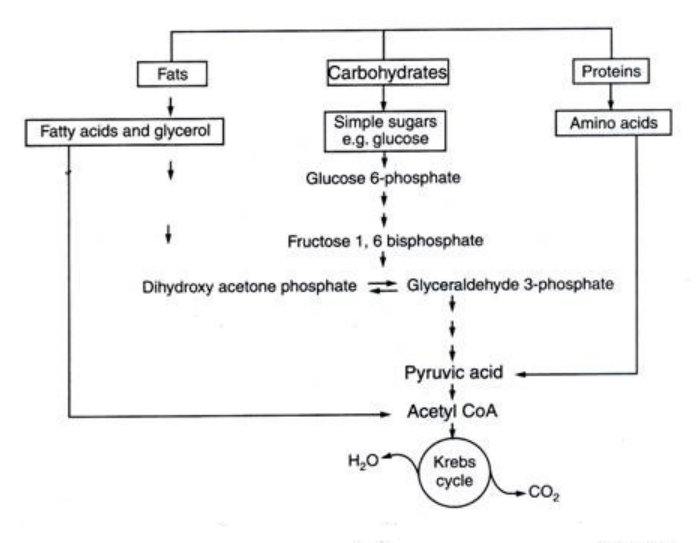
A. Glycolysis
- Catabolic: Glucose → Pyruvate → ATP & NADH
- Anabolic: Intermediates like G3P (glyceraldehyde-3-phosphate) can be used for:
- Amino acids synthesis
- Fatty acids synthesis
B. TCA / Krebs Cycle
- Catabolic: Acetyl-CoA → CO2 + NADH + FADH2 + GTP (energy)
- Anabolic: Intermediates provide precursors for:
- Citrate → Fatty acids
- α-Ketoglutarate → Glutamate → Amino acids
- Oxaloacetate → Aspartate → Amino acids & nucleotides
C. Pentose Phosphate Pathway (PPP)
- Catabolic: Glucose-6-phosphate → NADPH (for reductive reactions)
- Anabolic: Produces ribose-5-phosphate → nucleotide and nucleic acid synthesis
🔗 Significance of Amphibolic Pathways
- Energy efficiency: Combines energy release with biosynthesis
- Metabolic flexibility: Allows plants to adapt to nutrient availability
- Biosynthetic precursors: Supplies intermediates for amino acids, nucleotides, and lipids
- Integration: Connects catabolic respiration with anabolic growth pathways
⚡ Key Points to Remember
| Pathway | Catabolic Function | Anabolic Function |
|---|---|---|
| Glycolysis | Produces ATP & NADH | Provides G3P for amino acid and lipid synthesis |
| Krebs Cycle | Releases CO2, generates NADH/FADH2 | Citrate, α-Ketoglutarate, Oxaloacetate → precursors for biomolecules |
| Pentose Phosphate Pathway | Produces NADPH | Ribose-5-phosphate for nucleotides |
Tip to Remember: “Amphi = both” → Pathways are dual-purpose: break molecules for energy + build molecules for growth.
📦 Quick Recap
Amphibolic pathway: Serves both catabolic and anabolic roles
Respiration is amphibolic → Produces ATP and provides precursors for biosynthesis
Key pathways: Glycolysis, TCA/Krebs, Pentose phosphate pathway
Significance: Energy, building blocks, metabolic flexibility