| Date | November 2017 | Marks available | 1 | Reference code | 17N.3.HL.TZ0.14 |
| Level | Higher level | Paper | Paper 3 | Time zone | TZ0 |
| Command term | Suggest | Question number | 14 | Adapted from | N/A |
Question
To assess the impact of introduced cats (Felis silvestris) that prey on native species, a study was carried out on 120 islands around the world. The graph shows the impact of F. silvestris on reptiles, birds and mammals.
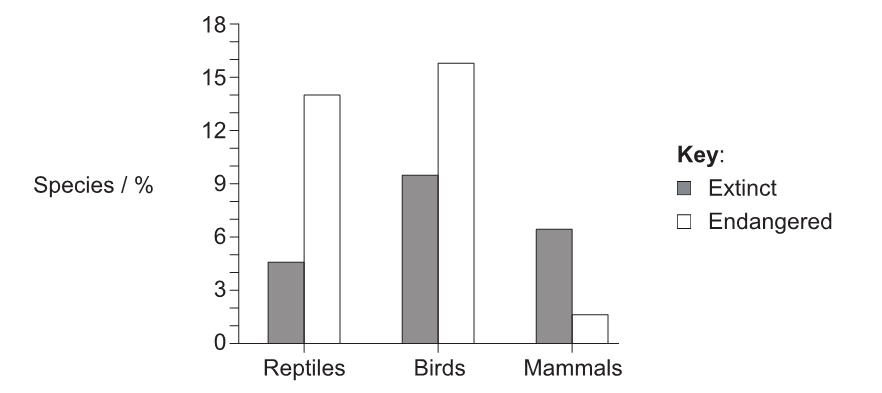
[Source: A global review of the impacts of invasive cats on island endangered vertebrates, F. M. Medina et al. (2011) Global Change Biology, 17, pp. 3503–3510. Reproduced with permission from John Wiley and Sons.]
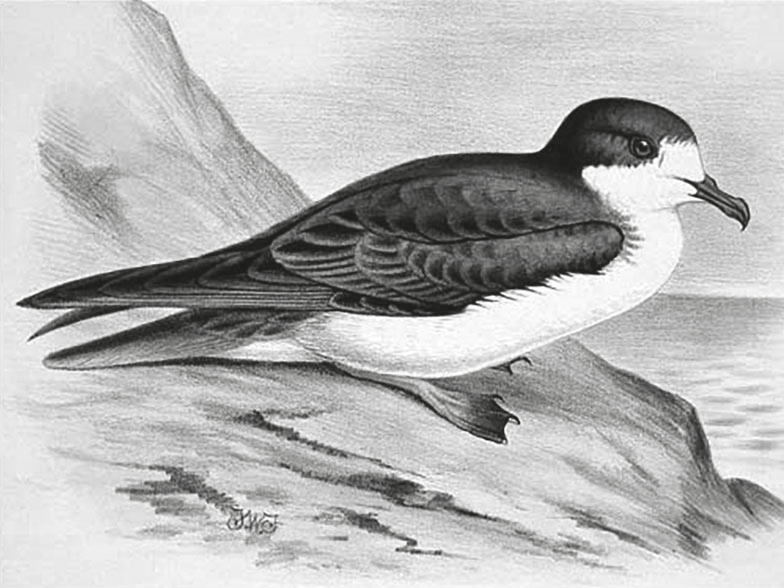
The ‘Ua‘u petrel (Pterodroma sandwichensis) is considered to be an indicator species in the Hawaiian Islands.
Identify how the pattern in mammals is different from reptiles and birds.
Describe how invasive species such as F. silvestris can have a significant impact on native species.
Suggest a method to limit the impact of F. silvestris on native species.
State the role of an indicator species.
Identify possible approaches to maintain the population of P. sandwichensis.
Markscheme
a. more extinct than endangered «in mammals as opposed to reptiles and birds»
b. total percentage extinct plus endangered mammals lower than reptiles and birds
[Max 1 Mark]
a. cats/invasive species compete with native species for food/habitat/resources
OWTTE
b. invasive species/cats may reduce/endanger native populations
c. invasive species/cats may change the structure/balance of the food web/chain
[Max 2 Marks]
a. control population/sterilization «of cats»/culling/hunting
b. keep household cats indoors
[Max 1 Mark]
a. early warning system
b. provide information on environmental conditions/ecosystem
OWTTE
[Max 1 Mark]
a. ex-situ/zoos/captive breeding
b. control predators
c. in-situ/management of natural reserves/breeding habitats/parks/resources/clean-up pollution
d. education
OR
government legislation
Accept any other valid answer
[Max 2 Marks]
| Date | November 2016 | Marks available | 3 | Reference code | 16N.3.HL.TZ0.15 |
| Level | Higher level | Paper | Paper 3 | Time zone | TZ0 |
| Command term | Suggest | Question number | 15 | Adapted from | N/A |
Question
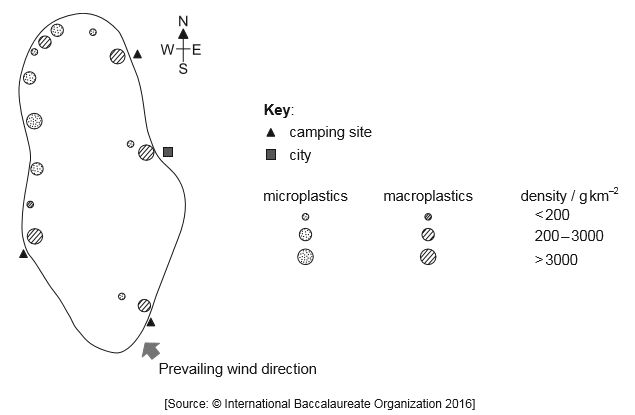
The sketched map shows the density of microplastics and macroplastics found in a lake within a national park.
Predict one example of macroplastic pollution that is likely to be found in this lake.
State two possible effects on organisms of microplastic pollution.

Outline the effect of wind on the distribution of plastic pollution in this lake.
Suggest changes in the management of the national park that could reduce the amount of macroplastic pollution.
Markscheme
plastic bottles
OR
fishing gear
OR
plastic bags
OR
plastic wrappers
Award [1] for any source.
Allow any other valid named source.
a. ingestion can reduce feeding
OR
false feeling of satiation
b. microplastics absorb toxins from water
c. filter feeders ingest the microplastics with the toxins
d. biomagnifications/bioaccumulation
a. microplastic density higher along the «north» western shore than the eastern shore
OR
wind blows plastics to opposite coast
OR
wind blows plastics away from their source/city/camping grounds
OR
wind increases degradation of macroplastics into microplastics
b. wind causes currents which moves the plastics
c. macroplastic pollution less affected by wind than microplastic pollution
a. improve city waste disposal
b. recycling programs
OR
develop community service teams to collect plastics «around the lake»/OWTTE
c. place litter containers/garbage cans close to camping sites
d. fines for those causing pollution
OR
pass littering laws
| Date | May 2016 | Marks available | 2 | Reference code | 16M.3.HL.TZ0.17 |
| Level | Higher level | Paper | Paper 3 | Time zone | TZ0 |
| Command term | Outline | Question number | 17 | Adapted from | N/A |
Question
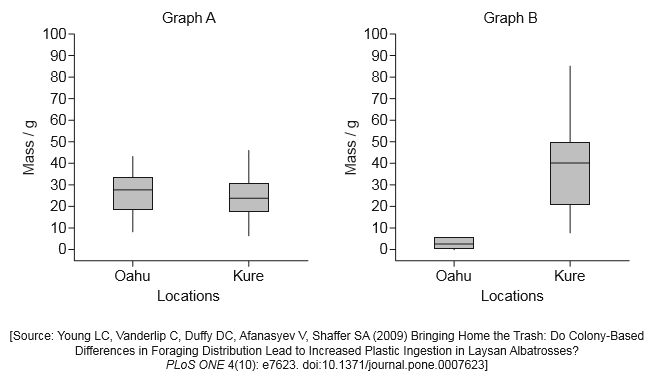
The Laysan Albatross (Phoebastria immutabilis) sometimes ingests plastic. A bolus is a pellet made of material that the albatross cannot digest, so brings it back up from its stomach to its mouth and then ejects the indigestible matter. Graph A indicates the mass of indigestible natural material, such as bones and octopus beaks, in the bolus of birds at two different locations. Graph B indicates the mass of plastic in the bolus at both locations.
Suggest one reason for the Laysan Albatross ingesting indigestible plastic.
Suggest a reason for the difference in ingested plastic in the diets of the Laysan Albatross in the two locations.
Outline the origin of microplastic debris in the marine environment.
Using microplastics as an example, outline the concept of biomagnification.
Markscheme
«Coloured object» mistaken for food
OR
skimming of ocean surface for food leads to plastic intake
Ocean currents concentrate plastic debris
Kure receives more debris than Oahu
More plastic available/more exposure to human populations/waste in the environment of Kure
«Macro» plastics blown/carried/washed from land sources into the ocean
Degraded over time
To form microplastic fragments
Substances already containing microplastics «eg: washing/cleansing products» get into water
Microplastic ingested by organisms at lower trophic levels
Accumulates in the tissues/guts of organisms
Becomes concentrated in the organs/tissues of organisms as moves through the food chain/at higher trophic levels
| Date | May 2015 | Marks available | 2 | Reference code | 15M.3.HL.TZ1.10 |
| Level | Higher level | Paper | Paper 3 | Time zone | Time zone 1 |
| Command term | Describe | Question number | 10 | Adapted from | N/A |
Question
During the 1980s, a tiny invasive crustacean Bythotrephes cederstroemii entered the eastern Great Lakes from Europe (probably via freshwater or mud in the ballast water of merchant ships) and eventually colonized Lake Michigan. Bythotrephes reproduces very quickly and eats common zooplankton, disrupting the food web by directly competing with small juvenile resident fish. Bythotrephes avoids predation by larger fish through the timing of its activities which have been investigated in offshore waters of Lake Michigan at various depths during the day and night.
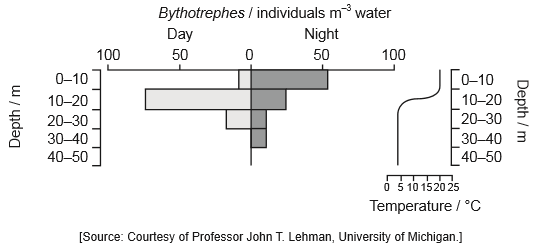
State the depth range showing the most Bythotrephes during the night.
Describe the distribution of Bythotrephes during the day.
Deduce the responses of Bythotrephes to temperature and light.
Explain the change in distribution of Bythotrephes between day and night in terms of its position in the lake food chain.
Markscheme
0–10 meters
a. Bythotrephes found at all depths down to 20–30 m/none below 30 m;
b. greatest number/density (of organisms) at 10–20 m;
c. least number/density (of organisms) at 0–10 m;
a. avoids/driven away by light (to colder water);
b. in absence of light attracted to warmer water;
c. can tolerate a wide range of temperature (accept numbers in range of 4/5–20/25°C);
a. zooplankton found in (warmer) surface water where small plants / algae/phytoplankton are found due to light;
b. as predator, Bythotrephes moves up to the surface to feed on zooplankton at night;
c. as prey, Bythotrephes moves to lower/darker depths during the day to avoid being (easily) seen by predators/fish;
| Date | May 2015 | Marks available | 2 | Reference code | 15M.3.HL.TZ2.10 |
| Level | Higher level | Paper | Paper 3 | Time zone | Time zone 2 |
| Command term | Discuss | Question number | 10 | Adapted from | N/A |
Question
The filamentous green alga (Cladophora) forms mats along the shore of certain fresh water lakes. When the mats become stranded on beaches, they produce a bad odour from the action of decomposers. A study was undertaken on the abundance and persistence of fecal indicator bacterium Escherichia coli in the mats and in the water at three beach sites on one lake. The number of colonies (colony-forming unit or CFU) that grew from bacteria in a 100 gram sample of mat or water collected on day 0 at the three sites was measured on four days over an eight day period to test the survival of E. coli.
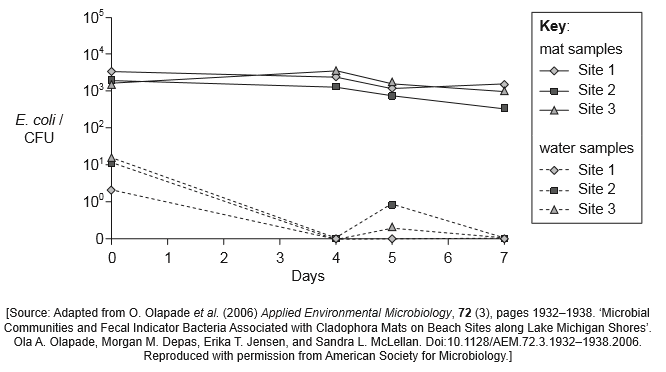
Identify the site with the lowest average CFU of E. coli in the water samples.
Distinguish between the trends in the survival of E. coli on mat samples and in water samples over time.
Scientists formerly related the population of Cladophora to changes in phosphorous levels in the lake. However, phosphorous quantities have decreased but Cladophora has recently increased along the shore. Suggest two reasons, other than phosphorous, for the change in population growth of Cladophora in the lake.
Discuss the possible ecological relationships between E. coli and Cladophora.
Markscheme
(site) 1
a. (CFU of) E. coli on mats remains higher/almost 102 more than in the water samples;
b. over time in mats the values do not change much while in water they decrease/disappear;
a. excess nitrogen from fertilizers as run-off from agricultural lands;
b. excess organic matter from sewage overflow;
c. change in temperature/global warming;
d. change in pH;
Do not accept a general statement of minerals or fertilizers in the water.
a. Cladophora provide a habitat for E. coli so more E. coli/CFUs (in mats);
b. Cladophora provide more food for E. coli so more E. coli/CFUs (in mats);
c. Cladophora in mats are dead and decomposed by E. coli /Cladophora in water are alive so not decomposed by E. coli;
| Date | November 2015 | Marks available | 2 | Reference code | 15N.3.HL.TZ0.10 |
| Level | Higher level | Paper | Paper 3 | Time zone | TZ0 |
| Command term | Discuss | Question number | 10 | Adapted from | N/A |
Question
In South Korea, flocks of birds of the tit family (Paridae) forage together on trees for food. Researchers observed four species of Paridae to determine whether they shared the same habitat in the trees and whether their position on the tree depended on their size. The leafy part of the tree (crown) was divided into nine sections, three according to height from the ground and three according to the distance from the tree trunk. Observations were also made of birds foraging in the bushes surrounding the trunk and on the ground below the tree.
The chart shows the relative use of each section of the habitat by the birds.
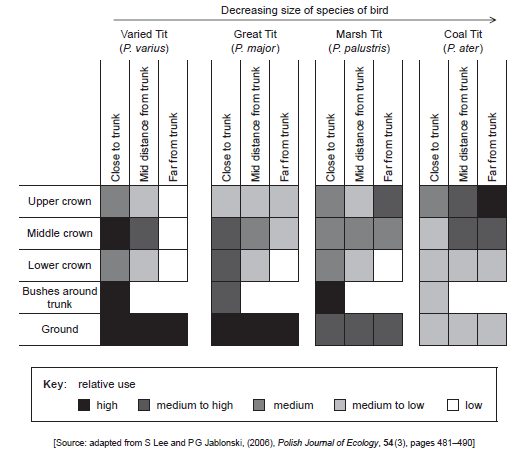
State the relative use of the habitat by the Great Tit in the upper crown of the tree close to the trunk.
Identify the section of habitat used least by the birds.
Compare how the Varied Tit and the Marsh Tit use the habitat in the upper crown of the tree.
State how the distribution of birds changes with their size in the middle crown of the tree.
Suggest one reason why few Varied Tits were found far from trunk.
Discuss whether the results for the Varied Tit and Coal Tit indicate competitive exclusion.
Markscheme
medium to low
lower crown, far from trunk
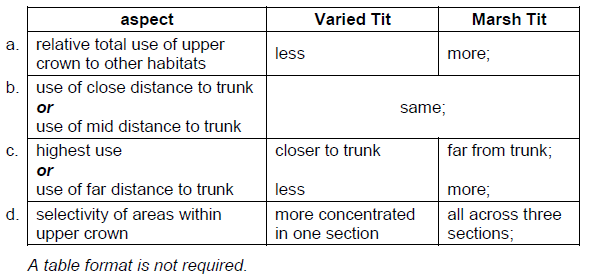
smaller birds make more use of the habitat further from the trunk / larger birds make more use of the habitat closer to the trunk
their food is close to the trunk / fewer predators close to trunk / too big for small outside branches
Accept any valid suggestion.
a. the competitive exclusion principle states that no two species can coexist if they occupy the same niche/compete for the same resources;
b. competitive exclusion is supported as there is little overlap between the two species in the habitat;
c. competitive exclusion is not supported as there is some overlap between the species;
d. we do not have enough information about the resources required by each species to say if competitive exclusion is occurring;
| Date | May 2013 | Marks available | 1 | Reference code | 13M.3.HL.TZ1.10 |
| Level | Higher level | Paper | Paper 3 | Time zone | Time zone 1 |
| Command term | State | Question number | 10 | Adapted from | N/A |
Question
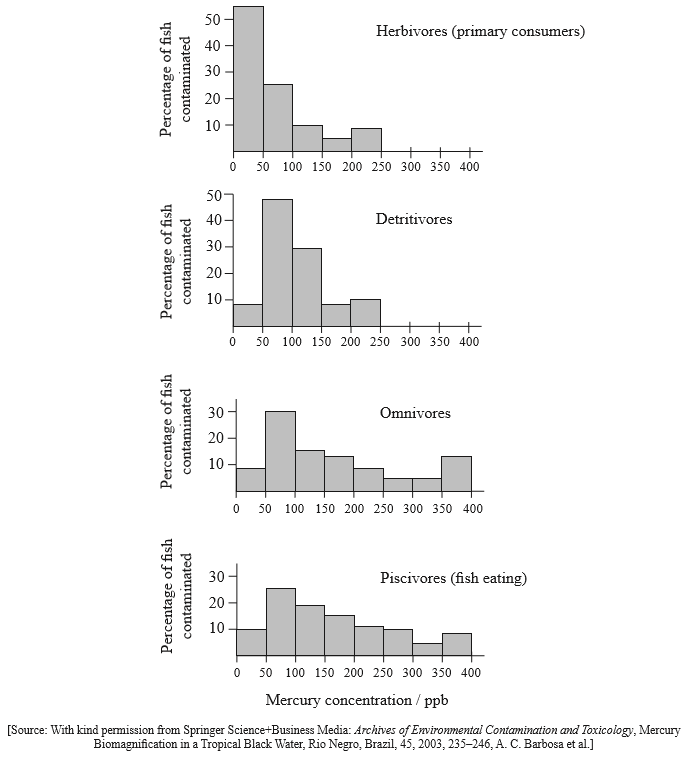
Indigenous human populations living along riverbanks in the Amazon basin often rely heavily on fish as a major part of their diet. The data shown below come from a study that was carried out to investigate levels of mercury contamination in the Rio Negro basin in Brazil. Mercury concentration was measured in fish belonging to four different trophic levels and is shown in parts per billion (ppb).

State the trophic level of the fish that presents the least risk of mercury contamination for human consumers.
Compare the levels of mercury found in herbivores (primary consumers) and detritivores.
Explain the large range of mercury concentrations seen in the piscivores.
Markscheme
herbivores (primary consumers)
a. same range of mercury concentrations/up to 200–250 (ppb);
b. levels above 50 (ppb) are lower/less common in herbivores than in detritivores / vice versa;
c. (0–) 50 (ppb) is most common in herbivores whereas (50–) 100 (ppb) is most common in detritivores;
a. piscivores feed at different trophic levels (within the food chain);
b. piscivores that feed on herbivores / detritivores will have lower levels of contamination;
c. piscivores that feed on carnivores/omnivores/top of food chain will have high levels;
| Date | May 2013 | Marks available | 2 | Reference code | 13M.3.HL.TZ1.1 |
| Level | Higher level | Paper | Paper 3 | Time zone | Time zone 1 |
| Command term | Discuss | Question number | 1 | Adapted from | N/A |
Question
Indigenous human populations living along riverbanks in the Amazon basin often rely heavily on fish as a major part of their diet. The data shown below come from a study that was carried out to investigate levels of mercury contamination in the Rio Negro basin in Brazil. Mercury concentration was measured in fish belonging to four different trophic levels and is shown in parts per billion (ppb).
Discuss how an understanding of biomagnification could help these human populations reduce their risk of mercury poisoning while maintaining their traditional diet.
Markscheme
a. (recognize that) some fish are more contaminated than others;
b. identify and eat fish that are close to the start of a food chain;
c. avoid eating piscivores/omnivores/highly polluted species;
d. eat only piscivores that feed close to the start of a food chain;
| Date | May 2011 | Marks available | 2 | Reference code | 11M.3.HL.TZ2.10 |
| Level | Higher level | Paper | Paper 3 | Time zone | Time zone 2 |
| Command term | Determine | Question number | 10 | Adapted from | N/A |
Question
Cadmium is a heavy metal that can be toxic to many species. In a study, the concentration of cadmium was examined in the tissues of three soil arthropods, Neobisium muscorum, Platynothrus peltifer and Notiophilus biguttatus. The shaded area of each graph indicates the time that the organisms were exposed to cadmium in their environment, while the unshaded area indicates the time when cadmium was not present in their environment.
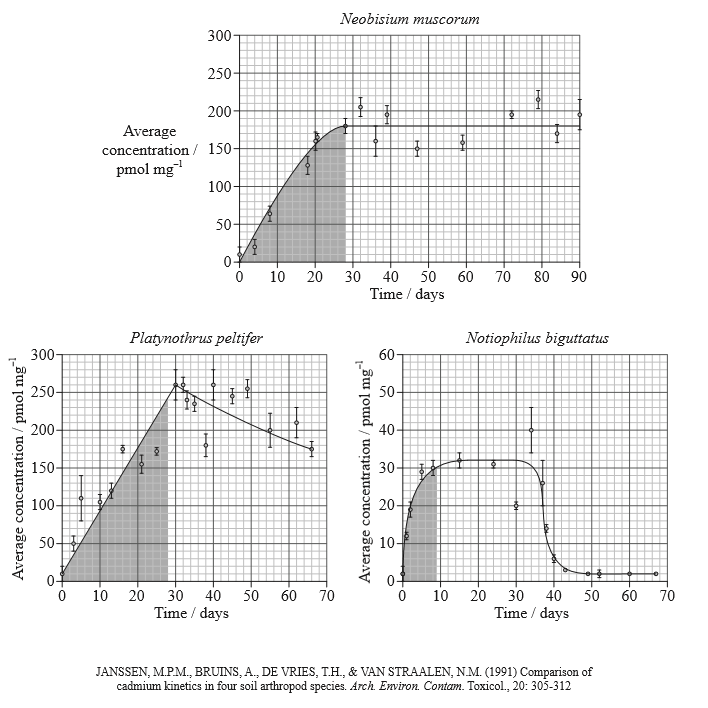
Identify the highest average concentration of cadmium found in P. peltifer.
Determine, with a reason from the data, which species is unable to eliminate cadmium.
State the species that accumulates the least cadmium.
Suggest, with observations from the data, a reason why the species stated in (c)(i) accumulates the least cadmium.
Describe the possible effects of the presence of cadmium in food chains involving these arthropods.
Markscheme
260 pmol mg−1 (accept answers in the range of 255 pmol mg−1 to 265 pmol mg−1)
Neobisium muscorum;
level of cadmium remains high / does not decrease (when cadmium is removed);
Notiophilus biguttatus
can excrete/remove/eliminate cadmium (from its tissues);
faster reduction/removal / drops to lowest level after cadmium exposure;
cadmium levels stop rising sooner/rise slowing by day ten;
is less tolerant/dies when cadmium reaches a certain concentration;
exposed to cadmium for a shorter time/period;
cadmium accumulates along food chain / biomagnification / bioaccumulation;
heavy metals cause abnormal growth/behaviour/death/failure to reproduce;
Notiophilus biguttatus has less effect on the food chain (as it accumulates less);
cadmium harmful/lethal to organisms at/near the end of the food chain;
(death of arthropods) may change soil quality;
| Date | May 2010 | Marks available | 3 | Reference code | 10M.3.HL.TZ1.10 |
| Level | Higher level | Paper | Paper 3 | Time zone | Time zone 1 |
| Command term | Describe | Question number | 10 | Adapted from | N/A |
Question
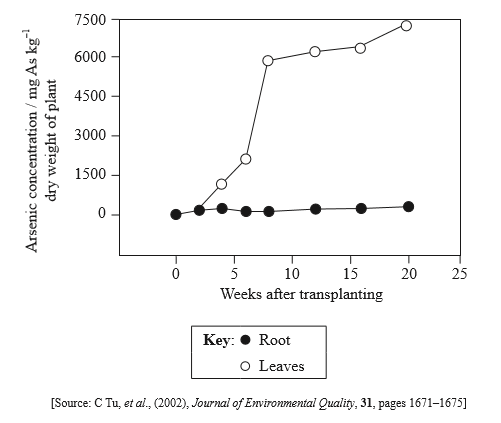
The element arsenic (As) is not needed for plant growth and development. The accumulation of arsenic in the Chinese brake fern (Pteris vittata) was studied. Young ferns with five or six leaves were transplanted to soil contaminated with arsenic and were grown for 20 weeks in a greenhouse.
The graph below shows the arsenic concentrations in leaves and roots of the Chinese brake fern during the 20 weeks after transplanting. Arsenic concentration is expressed as mg As kg−1 dry weight of plant.
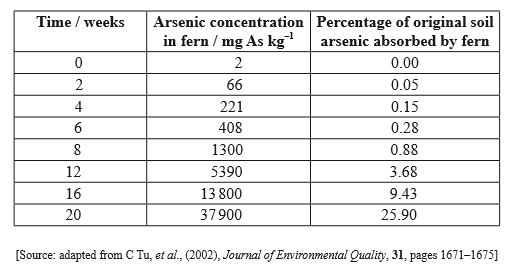
The table below shows the total amount of arsenic accumulated by the Chinese brake fern, expressed as a concentration in the plant tissue and as a percentage of the arsenic originally in the soil.
Using the data in the graph, describe the accumulation of arsenic in the Chinese brake fern.
Assuming the mean rate of arsenic accumulation over the first 20 weeks continued, calculate how long it would take to remove all the arsenic from the soil.
Using the data in the table, discuss the potential of using Chinese brake fern to remove arsenic from contaminated soil.
Suggest one possible consequence of arsenic accumulation in plants for other organisms in the community.
Markscheme
arsenic accumulates in leaves;
arsenic concentration (in leaves) increases rapidly in the first 7 weeks;
arsenic (in leaves) increases from 0 to approximately 6000 mg kg–1 at 7 weeks;
maximum arsenic level (in leaves) is about 7500 mg kg–1 at end of experiment / valid numerical example;
after week 7 arsenic concentration in plant increases more slowly/begins to plateau;
arsenic concentration in roots remains relatively unchanged throughout the experiment;
(Accept range of 7 – 10 weeks in all of above points)
77 weeks (Allow answers in range 70 – 80 weeks)
Chinese brake fern could be used to remove arsenic from soil;
after 20 weeks about 25 % of soil arsenic removed by fern;
arsenic concentration increases (rapidly) in fern (tissue) in 20 weeks;
eventually/longer periods may reach toxic levels for plant;
plants may become toxic for consumers;
arsenic may accumulate in the food chain / biomagnification;
| Date | November 2010 | Marks available | 1 | Reference code | 10N.3.HL.TZ0.10 |
| Level | Higher level | Paper | Paper 3 | Time zone | TZ0 |
| Command term | Suggest | Question number | 10 | Adapted from | N/A |
Question
Many factors affect the distribution of animal species including weather patterns. The mosquito Anopheles is a carrier of malaria, a disease that kills one to two million people annually. The eggs of the mosquito are laid in water and they hatch out as larvae before turning into adult mosquitoes. A study was undertaken to look at the influence of weather patterns on the incidence of bites on children. Being bitten increases the risk of catching malaria.
The graphs show human biting rates (HBR) by Anopheles gambiae and Anopheles funestus and precipitation over the study period.
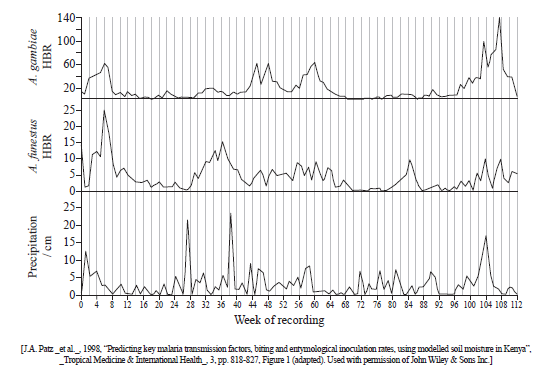
State the week number when the highest human biting rate (HBR) is found for A. gambiae.
Calculate the difference in peak HBR for A. gambiae and A. funestus for week 6.
Evaluate the effect of increased precipitation on HBR for both species.
Suggest how predictions of global climate changes, such as predictions of precipitation patterns, could be used to help control malaria.
Suggest another factor which might affect the ecological distribution of mosquitoes.
Suggest a biological control that might be introduced to reduce HBR.
Markscheme
(highest HBR for Anopheles gambiae/A. gambiae week) 107/108
35 (accept answers in the range of 34 to 37)
a. both species show relationship between elevated precipitation and higher HBR (e.g. between week 0 and week 8 / week 100 and week 108);
b. there is a lag between the period of precipitation and the increase in HBR;
c. sometimes elevated precipitation does not lead to peaks of HBR (e.g. week 27);
d. precipitation has a greater effect on Anopheles gambiae/A. gambiae;
a. spraying insecticides just before rainy seasons;
b. draining swamps before (and after) rain;
c. providing (endangered) population with repellents/mosquito nets before rainy season;
temperature / breeding site / food supply / predators / other reasonable answer
Do not accept global warming.
a. using natural predators of mosquitoes;
b. using natural pathogens of mosquitoes;
c. introduction of sterile males;
d. setting traps baited with mosquito pheromones/hormones;