Topic 4 : Ecology : 4.1 Species, communities and ecosystems

Topic 4 : Ecology
4.1 Species, communities and ecosystems

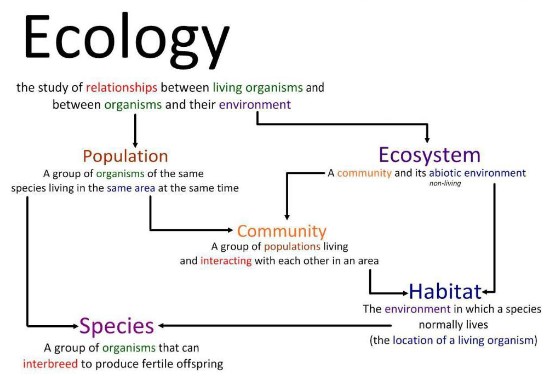
Definitions of ecology:

  • Species: a group of organisms that can interbreed and produce fertile offsprings
  • Population: a grooup of organisms of the same species in the same area at the same time
  • Community: a group of populations living and iteracting with each other in an area
  • Habitat: the environment in which a species normaly lives
  • Ecosystem: a community and its abiotic factors
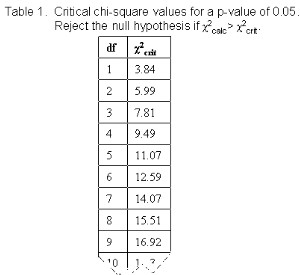
Autotrophs:

  • An organism that synthesizes its own organic molecules (makes their own food) from simple inorganic substances.
  • Usually autotrophs convert light energy to chemical energy through photosynthesis (producers)
  • Chemoautotrophs obtain their energy through the oxidation of inorganic molecules in their environments

Mixotrophs:

  • Some unicellular organisms use both methods of nutrition such as Euglena gracilis which have chloroplasts to carry out photosynthesis when there is enough sunlight; however, they can also feed on detritus (dead or decaying material) or other smaller organisms. It has a combination of different modes of nutrition.

Heterotrophs:

  • An organism that obtains organic molecules from other living organisms or their dead remains. (consumer)
  • Heterotrophs consume other organisms because they cannot make their own food.
  • Consist of:
  • Detritivore: an organism that obtains food by ingesting non-living organic matter such as detritus (decaying organic matter) and humus
    (decaying plant material) i.e. Vultures and earthworms.
  • Saprotroph: an organism that lives on or within nonliving organic matter, secreting digestive enzymes (external digestion) into it and
    absorbing the nutrients produced by digestion. Saprotrophs help with the decaying or break down of dead organic materials.
  • Herbivore: feed on producers (autotrophs)
  • Omnivore: feed on a combination of producers and consumers
  • Carnivore: feed on consumers
  • Scavenger: specialized carnivore that feed mostly on dead and decaying animals

Quadrant Sampling:

  • Estimate population density/size
  • Measure the distribution of species
  • Place systematically – finding the change of distribution
  • Place randomly – finding the population density/size
  • Limited to large mobile animals
  • Suitable to plants and small, slow-moving animals.
  • If the presence or absence of more than one species is recorded in every quadrat during the sampling of a habitat, one can test for an association between the species
  • If two different species are found in the same habitat and within the same quadrat, they are positively associated. This basically means that one species is more likely to be found, when the other species is also present
  • A negative association is when two species tend not to occur together
  • If there is no association between the two species, negative or positive, the species are said to be independent. Basically this means that the location of
    species A has no effect on species B and vice versa.
  • One can test these associations using a chi-squared test (called Chi Square Test for Independence)

Chi-square test:

  • A chi-square test is a statistical test that can be used to determine whether observed frequencies are significantly different from expected frequencies
  • These statistical tests enable us to compare observed and expected frequencies empirically and to decide if the results we see are statistically significant. Statistical significance in this case implies that the differences are not due to chance alone, but instead may be caused by other factors at work.
  • This is the formula for a chi-squared test: \(X^2 = \sum \frac{(o_i-e_i)^2}{e_i}\), where o means observed group and e means expected groups.
  • What it basically means is the sum of the (observed minus the expected) squared, divided by
    the expected.
  • We can have two hypothesis out of Chi-square test
  • Null hypothesis: data is due to chance and is random. There is no association between those two species.
  • Alternative hypothesis: data is not due to chance and is not random, something influence
    the data
  • Check the value with degree of freedom (0.05 column) corresponding the value of (number of
    set of data – 1) e.g. 2 species -1 = 1
  • f the result is less than the critical value, accept null hypothesis
  • If the result is more than the critical value, reject the null hypothesis

Scroll to Top