1.6C Plotting and Interpreting Solubility Curves
A solubility curve is a graph that shows how the solubility of a substance changes with temperature.
Solubility is measured in:
\( \mathrm{g\ of\ solute\ per\ 100\ g\ of\ solvent} \)
How to Plot a Solubility Curve
When given experimental data:
• Temperature is plotted on the x-axis.
• Solubility is plotted on the y-axis.
• Points are plotted accurately.
• A smooth curve (line of best fit) is drawn.
Interpreting a Solubility Curve
From the graph, you can:
• Find the maximum amount that dissolves at a given temperature.
• Determine whether a solution is saturated or unsaturated.
• Calculate how much will crystallise when cooled.
Understanding Positions Relative to the Curve
| Position on Graph | Meaning |
|---|---|
| On the curve | Saturated solution |
| Below the curve | Unsaturated solution (more can dissolve) |
| Above the curve | Excess solute present (will not dissolve) |
Typical Trend
For most solid solutes, solubility increases as temperature increases because particles have more energy to overcome attractive forces.
Exam Skills
• Always read values carefully from axes.
• Watch units (g per 100 g solvent).
• Show working clearly when calculating crystallisation.
Example 1 (Conceptual):
A point lies below the solubility curve at \( 50^\circ \mathrm{C} \). What does this mean?
▶️ Answer/Explanation
It means the solution is unsaturated.
More solute can still dissolve at that temperature.
Example 2 (Numerical):
At \( 70^\circ \mathrm{C} \), the solubility of a salt is \( 80 \, \mathrm{g/100g\ water} \). At \( 20^\circ \mathrm{C} \), it is \( 30 \, \mathrm{g/100g\ water} \).
If \( 80 \, \mathrm{g} \) is dissolved at \( 70^\circ \mathrm{C} \) and the solution is cooled to \( 20^\circ \mathrm{C} \), calculate how much crystallises.
▶️ Answer/Explanation
Maximum at \( 20^\circ \mathrm{C} \) = \( 30 \, \mathrm{g} \)
Crystallised mass = \( 80 – 30 = 50 \, \mathrm{g} \)
So \( 50 \, \mathrm{g} \) of salt crystallises out.
Example 3 (Hard):
Describe how you would obtain pure crystals of a salt from a saturated solution at \( 80^\circ \mathrm{C} \) using a solubility curve.
▶️ Answer/Explanation
First, identify the solubility at \( 80^\circ \mathrm{C} \) from the graph to ensure the solution is saturated.
Allow the solution to cool slowly to a lower temperature.
As the temperature decreases, solubility decreases.
Excess solute will crystallise out of the solution.
Filter the crystals from the remaining solution.
Dry the crystals between filter papers to obtain pure solid.
1.7C Practical: Investigating the Solubility of a Solid in Water at a Specific Temperature
This practical determines the maximum mass of a solid that dissolves in \( 100 \, \mathrm{g} \) of water at a fixed temperature.
Solubility is measured in:
\( \mathrm{g\ of\ solute\ per\ 100\ g\ of\ water} \)
Aim
To determine the solubility of a solid at a chosen temperature (for example \( 30^\circ \mathrm{C} \)).
Apparatus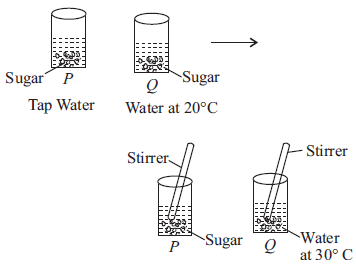
- Beaker
- Thermometer
- Balance (±0.01 g)
- Stirring rod
- Evaporating basin
- Bunsen burner / water bath
Method
1. Measure a known mass of water (e.g. \( 50 \, \mathrm{g} \)).
2. Heat or cool the water to the chosen temperature and keep it constant.
3. Add small amounts of the solid while stirring.
4. Continue adding until no more dissolves (solid remains at the bottom).
5. Record the total mass of solid added.
This gives the mass of solute that forms a saturated solution at that temperature.
Calculating Solubility
If the mass dissolved is for a different amount of water, convert to per \( 100 \, \mathrm{g} \).
\( \text{Solubility} = \dfrac{\text{Mass of solute dissolved}}{\text{Mass of water}} \times 100 \)
Control Variables
| Variable | How It Is Controlled |
|---|---|
| Temperature | Use thermometer and water bath |
| Mass of water | Measure accurately with balance |
| Type of solvent | Use distilled water only |
Sources of Error
Temperature may change during experiment.
Some solid may be lost during transfer.
Not all solid may have fully dissolved before adding more.
Example 1 (Conceptual):
Why must the temperature be kept constant during the investigation?
▶️ Answer/Explanation
Solubility depends on temperature.
If the temperature changes, the maximum amount that dissolves changes, making the result inaccurate.
Example 2 (Numerical):
A student dissolves \( 18 \, \mathrm{g} \) of salt in \( 60 \, \mathrm{g} \) of water at \( 25^\circ \mathrm{C} \) before saturation occurs.
Calculate the solubility in \( \mathrm{g/100g\ water} \).
▶️ Answer/Explanation
\( \text{Solubility} = \dfrac{18}{60} \times 100 \)
\( = 30 \, \mathrm{g/100g\ water} \)
So the solubility is \( 30 \, \mathrm{g} \) per \( 100 \, \mathrm{g} \) of water at \( 25^\circ \mathrm{C} \).
Example 3 (Hard):
Suggest two improvements to increase the accuracy of this experiment and explain why they help.
▶️ Answer/Explanation
Use a water bath instead of direct heating to keep the temperature constant.
This ensures the solubility is measured at the correct temperature.
Repeat the experiment and calculate an average value.
This reduces random errors and improves reliability.