3.14C Reaction Profile Diagrams Showing \( \Delta H \) and Activation Energy
Definition:
A reaction profile diagram (energy level diagram) shows how the energy of a system changes during a chemical reaction.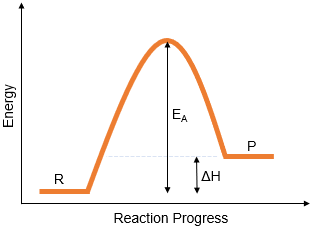
It shows:
- The energy of the reactants.
- The energy of the products.
- The activation energy \( E_a \).
- The enthalpy change \( \Delta H \).
Axes on the Diagram
- Vertical axis: Energy.
- Horizontal axis: Progress of reaction.
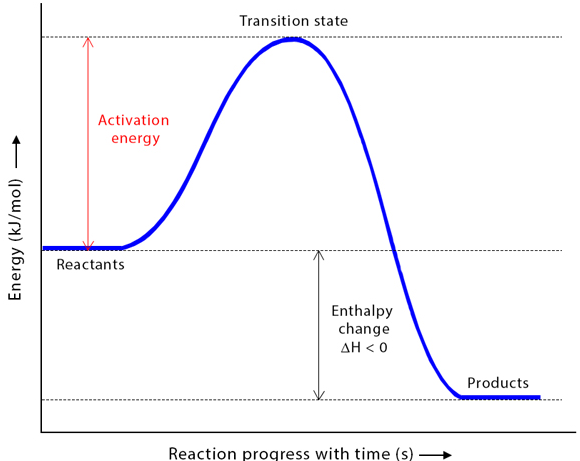
1. Activation Energy \( E_a \)
Activation energy is the minimum energy required for a reaction to occur.
- Shown as the energy difference between reactants and the peak of the curve.
- All reactions require activation energy.
\( E_a = \text{Energy at peak} – \text{Energy of reactants} \)
2. Enthalpy Change \( \Delta H \)
Enthalpy change is the difference in energy between reactants and products.
\( \Delta H = \text{Energy of products} – \text{Energy of reactants} \)
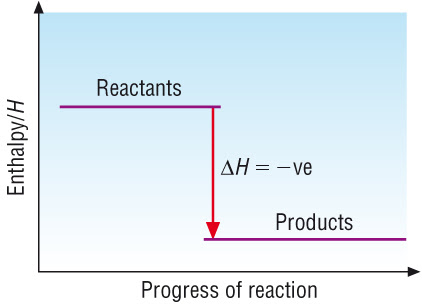
- If products are lower → \( \Delta H \) negative (exothermic).
- If products are higher → \( \Delta H \) positive (endothermic).
Exothermic Reaction Profile 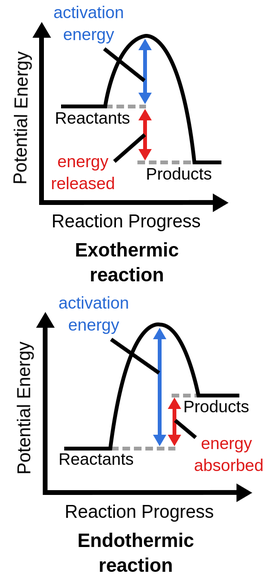
- Reactants start at higher energy level.
- Products end at lower energy level.
- Downward arrow shows \( \Delta H < 0 \).
- The peak shows activation energy.
Endothermic Reaction Profile
- Reactants start at lower energy level.
- Products end at higher energy level.
- Upward arrow shows \( \Delta H > 0 \).
- The peak shows activation energy.
Effect of a Catalyst on Reaction Profile
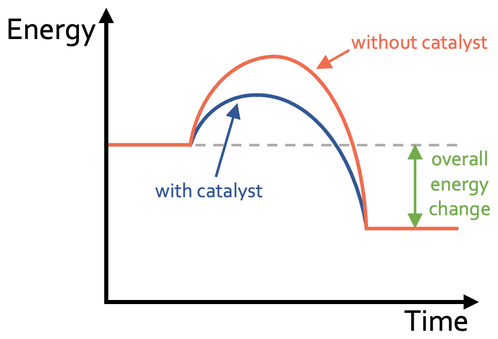
- Lowers activation energy \( E_a \).
- Peak of curve is lower.
- \( \Delta H \) remains unchanged.
- Energy levels of reactants and products stay the same.
| Feature | Exothermic | Endothermic |
|---|---|---|
| Position of products | Lower than reactants | Higher than reactants |
| Sign of \( \Delta H \) | Negative | Positive |
| Energy transferred | Released | Absorbed |
Example 1 (Conceptual):
On a reaction profile, the products are higher than the reactants. What does this show about \( \Delta H \)?
▶️ Answer/Explanation
\( \Delta H \) is positive.
The reaction is endothermic.
Energy has been absorbed.
Example 2 (Application):
Explain what the peak of a reaction profile represents.
▶️ Answer/Explanation
The peak represents activation energy.
It is the minimum energy needed for a reaction to occur.
Example 3 (Hard ):
Explain fully, using a reaction profile diagram, how a catalyst affects a reaction.
▶️ Answer/Explanation
The catalyst lowers the activation energy.
This is shown by a lower peak on the diagram.
The energy of reactants and products remains the same.
\( \Delta H \) is unchanged.
More particles can overcome the energy barrier.
The reaction rate increases.