Question
A study was conducted to look at the short-term effects of a change in diet on the risk of disease in young adults. The table shows data on the habitual diet of the participants as well as the study diet followed for two weeks.
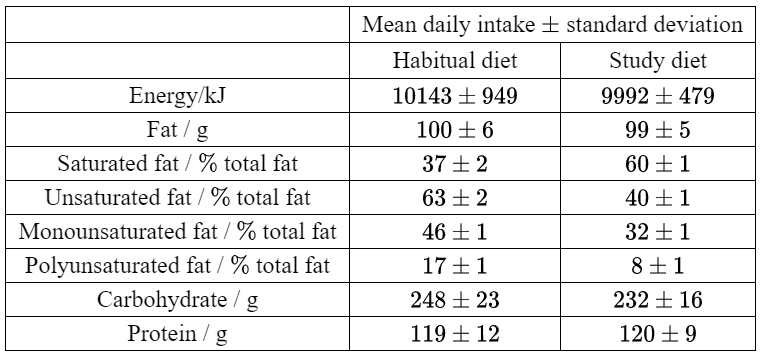
(a) Comment on the total energy content of the two diets. [1]
(b) Distinguish between the two diets. [2]
Total blood plasma cholesterol levels were measured before the study began and once a week after starting the study diet. Mean results are shown in the bar chart, including the standard deviation.
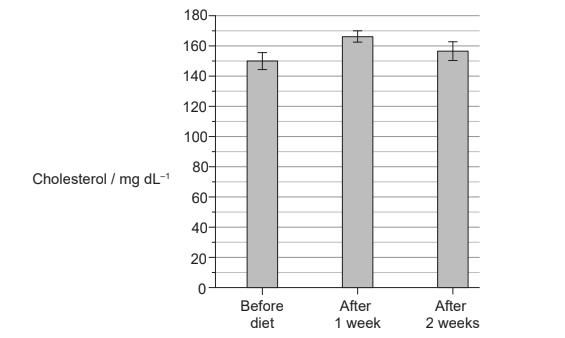
(c) Calculate, showing your working, the percentage change in mean cholesterol level after one week on the study diet. [2]
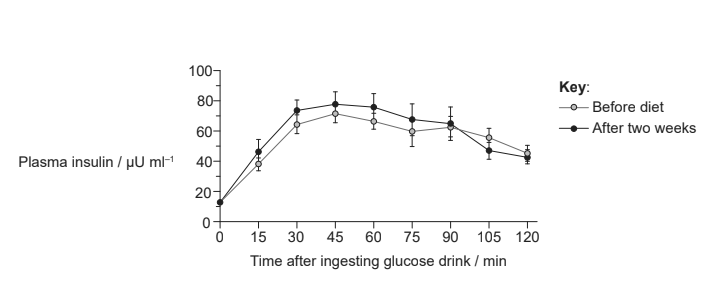
(d) (i) Compare the data for plasma insulin levels before and after the study diet. [2]
(ii) State which cells secrete insulin.[1]
(iii) Outline the reason for plasma insulin levels changing in the first 30 minutes of the test.[1]
▶️Answer/Explanation
Ans:
a.
a.energy is not changed (between the two diets);
b.study diet slightly lower in energy than habitual diet (but means/SD overlap);
c.spread of values show more variation for habitual diet / higher SD in habitual;
b.
a.they differ in percent of saturated and unsaturated fats (but not total fat);
b.percent of saturated fats is higher in study diet / lower in habitual diet;
c.(mono/poly) unsaturated fats decreased in study diet compared to habitual diet/more in habitual diet
OR
polyunsaturated fats in study diet only half of what they were in habitual diet;
d.(slightly) less carbohydrate in study;
c
((165–150) ÷ 150) x 100;
(=) 10 (%);
d.i.
a.both show same pattern of rise, level and then decrease / show same trend;
b.both show same/similar levels of insulin (at all times) due to overlapping error bars;
c.both rise for 30/45 minutes;
d.ii.
β cells of pancreas/islets (of Langerhans);
d.iii.
as blood glucose rises, insulin rises/increases to reduce the level/OWTTE;