Download IITian Academy App for accessing Online Mock Tests and More..

Question
The random variables \(X\), \(Y\) follow a bivariate normal distribution with product moment correlation coefficient \(\rho \). The following table gives a random sample from this distribution.

(a) Determine the value of \(r\), the product moment correlation coefficient of this sample.
(b) (i) Write down hypotheses in terms of \(\rho \) which would enable you to test whether or not \(X\) and \(Y\) are independent.
(ii) Determine the p-value of the above sample and state your conclusion at the 5% significance level. Justify your answer.
(c) (i) Determine the equation of the regression line of \(y\) on \(x\).
(ii) State whether or not this equation can be used to obtain an accurate prediction of the value of \(y\) for a given value of \(x\). Give a reason for your answer.
Answer/Explanation
Markscheme
(a) \(r = – 0.163\) A2
[2 marks]
(b) (i) \({{\text{H}}_0}:\rho = 0:{{\text{H}}_1}:\rho \ne 0\) A1
(ii) \(t = r\sqrt {\frac{{n – 2}}{{1 – {r^2}}}} = – 0.468 \ldots \) (A1)
\({\text{DF}} = 8\) (A1)
\(p{\text{-value}} = 2 \times 0.326 \ldots = 0.652\) A1
since \(0.652 > 0.05\), we accept \({{\text{H}}_0}\) R1
Note: Award (A1)(A1)A0 if the p-value is given as \(0.326\) without prior working.
Note: Follow through their p-value for the R1.
[5 marks]
(c) (i) \(y = – 0.257x + 5.22\) A1
Note: Accept answers which round to \(–0.26\) and \(5.2\).
(ii) no, because \(X\) and \(Y\) have been shown to be independent (or equivalent) A1
[2 marks]
Question
Jim is investigating the relationship between height and foot length in teenage boys.
A sample of 13 boys is taken and the height and foot length of each boy are measured.
The results are shown in the table.
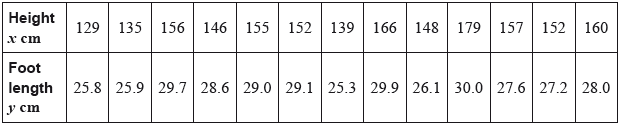
You may assume that this is a random sample from a bivariate normal distribution.
Jim wishes to determine whether or not there is a positive association between height and foot length.
Calculate the product moment correlation coefficient.
Find the \(p\)–value.
Interpret the \(p\)–value in the context of the question.
Find the equation of the regression line of \(y\) on \(x\).
Estimate the foot length of a boy of height 170 cm.
Answer/Explanation
Markscheme
Note: In all parts accept answers which round to the correct 2sf answer.
\(r = 0.806\) A2
\(4.38 \times {10^{ – 4}}\) A2
\(p\)-value represents strong evidence to indicate a (positive) association between height and foot length A1
Note: FT the \(p\)-value
\(y = 0.103x + 12.3\) A2
attempted substitution of \(x = 170\) (M1)
\(y = 29.7\) A1
Note: Accept \(y = 29.8\)