Question
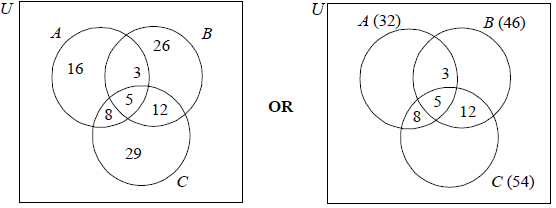
Beartown has three local newspapers: The Art Journal, The Beartown News, and The Currier.
A survey shows that
32 % of the town’s population read The Art Journal,
46 % read The Beartown News,
54 % read The Currier,
3 % read The Art Journal and The Beartown News only,
8 % read The Art Journal and The Currier only,
12 % read The Beartown News and The Currier only, and
5 % of the population reads all three newspapers.
Draw a Venn diagram to represent this information. Label A the set that represents The Art Journal readers, B the set that represents The Beartown News readers, and C the set that represents The Currier readers.[4]
Find the percentage of the population that does not read any of the three newspapers.[2]
Find the percentage of the population that reads exactly one newspaper.[2]
Find the percentage of the population that reads The Art Journal or The Beartown News but not The Currier.[2]
A local radio station states that 83 % of the population reads either The Beartown News or The Currier.
Use your Venn diagram to decide whether the statement is true. Justify your answer.[2]
The population of Beartown is 120 000. The local radio station claimed that 34 000 of the town’s citizens read at least two of the local newspapers.
Find the percentage error in this claim.[4]
Answer/Explanation
Markscheme
(A1) for three circles and a rectangle (U need not be seen)
(A1) for 5
(A1) for 3, 8 and 12
(A1) for 16, 26 and 29 OR 32, 46, 54 placed outside the circles. (A4)
Note: Accept answers given as decimals or fractions.[4 marks]
100 – (16 + 26 + 29) – (8 + 5 + 3 + 12) (M1)
100 – 71 – 28
Note: Award (M1) for correct expression. Accept equivalent expressions, for example 100 – 71 – 28 or 100 – (71 + 28).
= 1 (A1)(ft)(G2)
Note: Follow through from their Venn diagram but only if working is seen.[2 marks]
16 + 26 + 29 (M1)
Note: Award (M1) for 16, 26, 29 seen.
= 71 (A1)(ft)(G2)
Note: Follow through from their Venn diagram but only if working is seen.[2 marks]
16 + 3 + 26 (M1)
Note: Award (M1) for their 16, 3, 26 seen.
= 45 (A1)(ft)(G2)
Note: Follow through from their Venn diagram but only if working is seen.[2 marks]
True (A1)(ft)
100 – (1 –16) = 83 (R1)(ft)
OR
46 + 54 – 17 = 83 (R1)(ft)
Note: Do not award (A1)(R0). Follow through from their Venn diagram.[2 marks]
28% of 120000 (M1)
= 33600 (A1)
\({\text{% error}} = \frac{{(34000 – 33600)}}{{33600}} \times 100\) (M1)
Note: Award (M1) for 28 seen (may be implied by 33600 seen), award (M1) for correct substitution of their 33600 in the percentage error formula. If an error is made in calculating 33600 award a maximum of (M1)(A0)(M1)(A0), the final accuracy mark is lost.
OR
\(\frac{{34000}}{{120000}} \times 100\) (M1)
= 28.3(28.3333…) (A1)
\({\text{% error}} = \frac{{(28.3333… – 28)}}{{28}} \times 100\) (M1)
= 1.19% (1.19047…) (A1)(ft)(G3)
Note: % sign not required. Accept 1.07 (1.0714…) with use of 28.3. 1.18 with use of 28.33 and 1.19 with use of 28.333. Award (G3) for 1.07, 1.18 or 1.19 seen without working.[4 marks]
Question
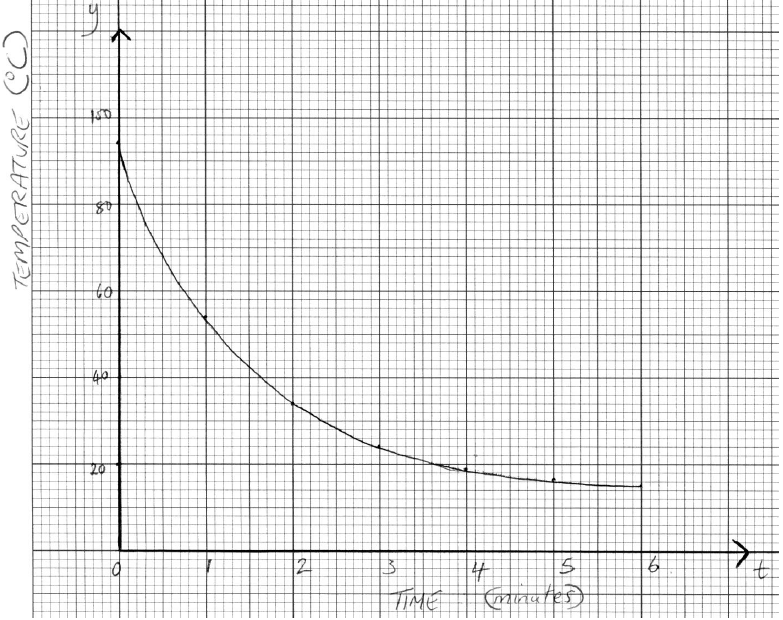
George leaves a cup of hot coffee to cool and measures its temperature every minute. His results are shown in the table below.

Write down the decrease in the temperature of the coffee
(i) during the first minute (between t = 0 and t =1) ;
(ii) during the second minute;
(iii) during the third minute.[3]
Assuming the pattern in the answers to part (a) continues, show that \(k = 19\).[2]
Use the seven results in the table to draw a graph that shows how the temperature of the coffee changes during the first six minutes.
Use a scale of 2 cm to represent 1 minute on the horizontal axis and 1 cm to represent 10 °C on the vertical axis.[4]
The function that models the change in temperature of the coffee is y = p (2−t )+ q.
(i) Use the values t = 0 and y = 94 to form an equation in p and q.
(ii) Use the values t =1 and y = 54 to form a second equation in p and q.[2]
Solve the equations found in part (d) to find the value of p and the value of q.[2]
The graph of this function has a horizontal asymptote.
Write down the equation of this asymptote.[2]
George decides to model the change in temperature of the coffee with a linear function using correlation and linear regression.
Use the seven results in the table to write down
(i) the correlation coefficient;
(ii) the equation of the regression line y on t.[4]
Use the equation of the regression line to estimate the temperature of the coffee at t = 3.[2]
Find the percentage error in this estimate of the temperature of the coffee at t = 3.[2]
Answer/Explanation
Markscheme
(i) 40
(ii) 20
(iii) 10 (A3)
Notes: Award (A0)(A1)(ft)(A1)(ft) for −40, −20, −10.
Award (A1)(A0)(A1)(ft) for 40, 60, 70 seen.
Award (A0)(A0)(A1)(ft) for −40, −60, −70 seen.
\(24 – k = 5\) or equivalent (A1)(M1)
Note: Award (A1) for 5 seen, (M1) for difference from 24 indicated.
\(k = 19\) (AG)
Note: If 19 is not seen award at most (A1)(M0).
 (A1)(A1)(A1)(A1)
Note: Award (A1) for scales and labelled axes (t or “time” and y or “temperature”).
Accept the use of x on the horizontal axis only if “time” is also seen as the label.
Award (A2) for all seven points accurately plotted, award (A1) for 5 or 6 points accurately plotted, award (A0) for 4 points or fewer accurately plotted.
Award (A1) for smooth curve that passes through all points on domain [0, 6].
If graph paper is not used or one or more scales is missing, award a maximum of (A0)(A0)(A0)(A1).
(i) \(94 = p + q\) (A1)
(ii) \(54 = 0.5p + q\) (A1)
Note: The equations need not be simplified; accept, for example \(94 = p(2^{-0}) + q\).
p = 80, q = 14 (G1)(G1)(ft)
Note: If the equations have been incorrectly simplified, follow through even if no working is shown.
y = 14 (A1)(A1)(ft)
Note: Award (A1) for y = a constant, (A1) for their 14. Follow through from part (e) only if their q lies between 0 and 15.25 inclusive.
(i) –0.878 (–0.87787…) (G2)
Note: Award (G1) if –0.877 seen only. If negative sign omitted award a maximum of (A1)(A0).
(ii) y = –11.7t + 71.6 (y = –11.6517…t + 71.6336…) (G1)(G1)
Note: Award (G1) for –11.7t, (G1) for 71.6.
If y = is omitted award at most (G0)(G1).
If the use of x in part (c) has not been penalized (the axis has been labelled “time”) then award at most (G0)(G1).
−11.6517…(3) + 71.6339… (M1)
Note: Award (M1) for correct substitution in their part (g)(ii).
= 36.7 (36.6785…) (A1)(ft)(G2)
Note: Follow through from part (g). Accept 36.5 for use of the 3sf answers from part (g).
\(\frac{{36.6785… – 24}}{{24}} \times 100\) (M1)
Note: Award (M1) for their correct substitution in percentage error formula.
= 52.8% (52.82738…) (A1)(ft)(G2)
Note: Follow through from part (h). Accept 52.1% for use of 36.5.
Accept 52.9 % for use of 36.7. If partial working (\(\times 100\) omitted) is followed by their correct answer award (M1)(A1). If partial working is followed by an incorrect answer award (M0)(A0). The percentage sign is not required.
Question
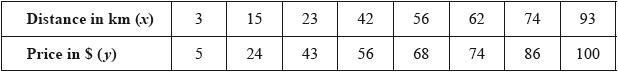
The table shows the distance, in km, of eight regional railway stations from a city centre terminus and the price, in \($\), of a return ticket from each regional station to the terminus.
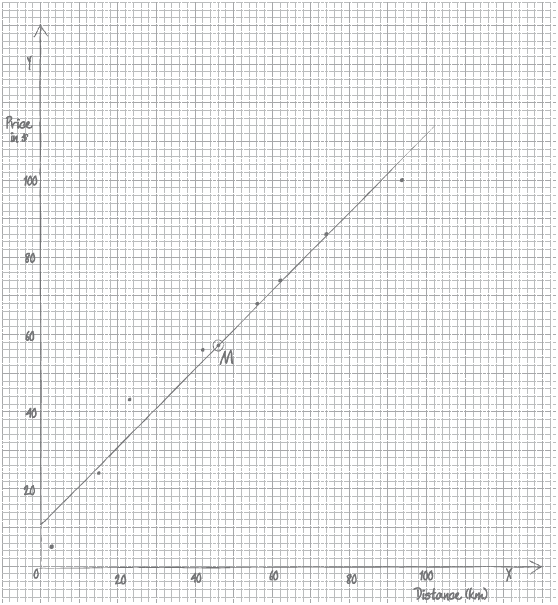
Draw a scatter diagram for the above data. Use a scale of \(1\) cm to represent \(10\) km on the \(x\)-axis and \(1\) cm to represent \(\$10\) on the \(y\)-axis.[4]
Use your graphic display calculator to find
(i) \(\bar x\), the mean of the distances;
(ii) \(\bar y\), the mean of the prices.[2]
Plot and label the point \({\text{M }}(\bar x,{\text{ }}\bar y)\) on your scatter diagram.[1]
Use your graphic display calculator to find
(i) the product–moment correlation coefficient, \(r\,;\)
(ii) the equation of the regression line \(y\) on \(x\).[3]
Draw the regression line \(y\) on \(x\) on your scatter diagram.[2]
A ninth regional station is \(76\) km from the city centre terminus.
Use the equation of the regression line to estimate the price of a return ticket to the city centre terminus from this regional station. Give your answer correct to the nearest \({\mathbf{\$ }}\).[3]
Give a reason why it is valid to use your regression line to estimate the price of this return ticket.[1]
The actual price of the return ticket is \(\$80\).
Using your answer to part (f), calculate the percentage error in the estimated price of the ticket.[2]
Answer/Explanation
Markscheme
 (A4)
(A4)
Notes: Award (A1) for correct scale and labels (accept \(x\) and \(y\)).
Award (A3) for \(7\) or \(8\) points plotted correctly.
Award (A2) for \(5\) or \(6\) points plotted correctly.
Award (A1) for \(3\) or \(4\) points plotted correctly.
Award at most (A1)(A2) if points are joined up.
If axes are reversed, award at most (A0)(A3).
If graph paper is not used, award at most (A1)(A0).[4 marks]
(i) \((\bar x = ){\text{ 46}}\) (G1)
(ii) \((\bar y = ){\text{ 57}}\) (G1)[2 marks]
\({\text{M}} (46, 57)\) plotted and labelled on the scatter diagram (A1)(ft)
Notes: Follow through from their part (b).
Accept \((\bar x,{\text{ }}\bar y)\) as the label.[1 mark]
(i) \(0.986\) \((0.986322…)\) (G1)
(ii) \(y = 1.01x + 10.3\) \((y = 1.01431 \ldots x + 10.3412 \ldots )\) (G1)(G1)
Notes: Award (G1) for \(1.01x\), (G1) for \(10.3\).
Award (G1)(G0) if not written in the form of an equation.
OR
\((y – 57) = 1.01(x – 46)\) \(\left( {y – 57 = 1.01431…(x – 46)} \right)\) (G1)(G1)(ft)
Note: Award (G1) for \(1.01\), (G1) for their \(57\) and \(46\).[3 marks]
straight line drawn on the scatter diagram (A1)(ft)(A1)(ft)
Notes: The line must be straight for either of the two marks to be awarded.
Award (A1)(ft) passing through their \({\text{M}}\) plotted in (c).
Award (A1)(ft) for correct \(y\)-intercept (between \(9\) and \(12\)).
Follow through from their \(y\)-intercept found in part (d).
If part (d) is used, award (A1)(ft) for their intercept \(( \pm 1)\).[2 marks]
\(y = 1.01431… \times 76 + 10.3412…\) (M1)
Note: Award (M1) for substitution of \(76\) into their regression line.
\( = 87.4295…\) (A1)(ft)
Note: Follow through from part (d). If 3 sf values are used the value is \(87.06\).
\(\$87\) (A1)(ft)(G2)
Notes: The final (A1) is awarded for their answer given correct to the nearest dollar.
Method, followed by the answer of \(87\) earns (M1)(G2). It is not necessary to see the interim step.
Where the candidate uses their graph instead of the equation, and arrives at an answer other than \(87\), award, at most, (G1)(ft).
If the candidate uses their graph and arrives at the required answer of \(87\), award (G2)(ft).[3 marks]
\(76\) is within the range of distances given in the data OR the correlation coefficient is close to \(1\). (R1)
Notes: Award (R1) if either condition is given.
Sufficient to indicate that \(76\) is ‘within the data range’ and the correlation is ‘strong’.
Allow \({r^2}\) close to \(1\).
Do not accept “within the range of prices”.[1 mark]
\({\text{Percentage error}} = \frac{{87 – 80}}{{80}} \times 100\) (M1)
Note: Award (M1) for correct substitution into formula.
\(8.75\%\) (A1)(ft)(G2)
Notes: Follow through from their answer to part (f).
Accept either the rounded or unrounded answer to part (f).
If no integer value seen in part (f), follow through from their unrounded answer to part (f).
Answer must be positive.[2 marks]
Question
A biologist is studying the relationship between the number of chirps of the Snowy Tree cricket and the air temperature. He records the chirp rate, \(x\), of a cricket, and the corresponding air temperature, \(T\), in degrees Celsius.
The following table gives the recorded values.
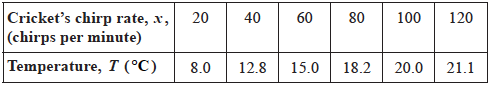
Draw the scatter diagram for the above data. Use a scale of 2 cm for 20 chirps on the horizontal axis and 2 cm for 4°C on the vertical axis.[4]
Use your graphic display calculator to write down the Pearson’s product–moment correlation coefficient, \(r\), between \(x\) and \(T\).[2]
Interpret the relationship between \(x\) and \(T\) using your value of \(r\).[2]
Use your graphic display calculator to write down the equation of the regression line \(T\) on \(x\). Give the equation in the form \(T = ax + b\).[2]
Calculate the air temperature when the cricket’s chirp rate is \(70\).[2]
Given that \(\bar x = 70\), draw the regression line \(T\) on \(x\) on your scatter diagram.[2]
A forest ranger uses her own formula for estimating the air temperature. She counts the number of chirps in 15 seconds, \(z\), multiplies this number by \(0.45\) and then she adds \(10\).
Write down the formula that the forest ranger uses for estimating the temperature, \(T\).
Give the equation in the form \(T = mz + n\).[1]
A cricket makes 20 chirps in 15 seconds.
For this chirp rate
(i) calculate an estimate for the temperature, \(T\), using the forest ranger’s formula;
(ii) determine the actual temperature recorded by the biologist, using the table above;
(iii) calculate the percentage error in the forest ranger’s estimate for the temperature, compared to the actual temperature recorded by the biologist.[6]
Answer/Explanation
Markscheme
(A4)
Notes: Award (A1) for correct scales and labels.
Award (A3) for all six points correctly plotted,
(A2) for four or five points correctly plotted,
(A1) for two or three points correctly plotted.
Award at most (A0)(A3) if axes reversed.
Accept tolerance for \(T\)-axis.
\({\text{0.977}}\;\;\;{\text{(0.977324}} \ldots {\text{)}}\) (G2)
Notes: Award (G1) for \(0.97\).
(Very) strong positive correlation (A1)(ft)(A1)(ft)
Notes: Award (A1) for (very) strong, (A1) for positive.
Follow through from part (b).
\(T = 0.129x + 6.82\) (G2)
Notes: Award (G1) for \(0.129x\), (G1) for \( + 6.82\).
Award a maximum of (G0)(G1) if the answer is not an equation.
\(0.129 \times 70 + 6.82\) (M1)
Note: Award (M1) for substitution of 70 into their equation of regression line.
OR
\(\frac{{8 + 12.8 + \ldots + 21.1}}{6}\) (M1)
\( = 15.9{\text{ }}(15.85)\) (A1)(ft)(G2)
Note: Follow through from part (d) without working.
regression line through \((70,{\text{ }}15.9)\) (A1)(ft)
Note: Accept \(15.9 \pm 0.2\).
Follow through from part (e).
with \(T\)-intercept, \(6.82\) (A1)(ft)
Note: Follow through from part (d). Accept \(6.82 \pm 0.2\).
In case the regression line is not straight (ruler not used), award (A0)(A1)(ft) if line passes through both their \((70,{\text{ }}15.9)\) and \((0,{\text{ }}6.82)\), otherwise award (A0)(A0).
Do not penalize if line does not intersect the \(T\)-axis.
\(T = 0.45z + 10\) (A1)
(i) \(0.45(20) + 10\) (M1)
Note: Award (M1) for correct substitution of \(20\) into their formula from part (g).
\( = 19\;\;\;(^\circ {\text{C}})\) (A1)(ft)(G2)
Note: Follow through from part (g).
(ii) \( = 18.2\;\;\;(^\circ {\text{C}})\) (A1)
(iii) \(\left| {\frac{{19 – 18.2}}{{18.2}}} \right| \times 100\% \) (M1)(A1)(ft)
Note: Award (M1) for substitution in the percentage error formula, (A1) for correct substitution.
\({\text{4.40% }}\;\;\;{\text{(4.39560}} \ldots {\text{)}}\) (A1)(ft)(G2)
Notes: Follow through from parts (h)(i) and (h)(ii).
Question
The line \({L_1}\) has equation \(2y – x – 7 = 0\) and is shown on the diagram.
The point A has coordinates \((1,{\text{ }}4)\).
The point C has coordinates \((5,{\text{ }}12)\). M is the midpoint of AC.
The straight line, \({L_2}\), is perpendicular to AC and passes through M.
The point D is the intersection of \({L_1}\) and \({L_2}\).
The length of MD is \(\frac{{\sqrt {45} }}{2}\).
The point B is such that ABCD is a rhombus.
Show that A lies on \({L_1}\).[2]
Find the coordinates of M.[2]
Find the length of AC.[2]
Show that the equation of \({L_2}\) is \(2y + x – 19 = 0\).[5]
Find the coordinates of D.[2]
Write down the length of MD correct to five significant figures.[1]
Find the area of ABCD.[3]
Answer/Explanation
Markscheme
\(2 \times 4 – 1 – 7 = 0\) (or equivalent) (R1)
Note: For (R1) accept substitution of \(x = 1\) or \(y = 4\) into the equation followed by a confirmation that \(y = 4\) or \(x = 1\).
(since the point satisfies the equation of the line,) A lies on \({L_1}\) (A1)
Note: Do not award (A1)(R0).[2 marks]
\(\frac{{1 + 5}}{2}\) OR \(\frac{{4 + 12}}{2}\) seen (M1)
Note: Award (M1) for at least one correct substitution into the midpoint formula.
\((3,{\text{ }}8)\) (A1)(G2)
Notes: Accept \(x = 3,{\text{ }}y = 8\).
Award (M1)(A0) for \(\left( {\frac{{1 + 5}}{2},{\text{ }}\frac{{4 + 12}}{2}} \right)\).
Award (G1) for each correct coordinate seen without working.[2 marks]
\(\sqrt {{{(5 – 1)}^2} + {{(12 – 4)}^2}} \) (M1)
Note: Award (M1) for a correct substitution into distance between two points formula.
\( = 8.94{\text{ }}\left( {4\sqrt 5 ,{\text{ }}\sqrt {80} ,{\text{ }}8.94427 \ldots } \right)\) (A1)(G2)[2 marks]
gradient of \({\text{AC}} = \frac{{12 – 4}}{{5 – 1}}\) (M1)
Note: Award (M1) for correct substitution into gradient formula.
\( = 2\) (A1)
Note: Award (M1)(A1) for gradient of \({\text{AC}} = 2\) with or without working
gradient of the normal \( = – \frac{1}{2}\) (M1)
Note: Award (M1) for the negative reciprocal of their gradient of AC.
\(y – 8 = – \frac{1}{2}(x – 3)\) OR \(8 = – \frac{1}{2}(3) + c\) (M1)
Note: Award (M1) for substitution of their point and gradient into straight line formula. This (M1) can only be awarded where \( – \frac{1}{2}\) (gradient) is correctly determined as the gradient of the normal to AC.
\(2y – 16 = – (x – 3)\) OR \( – 2y + 16 = x – 3\) OR \(2y = – x + 19\) (A1)
Note: Award (A1) for correctly removing fractions, but only if their equation is equivalent to the given equation.
\(2y + x – 19 = 0\) (AG)
Note: The conclusion \(2y + x – 19 = 0\) must be seen for the (A1) to be awarded.
Where the candidate has shown the gradient of the normal to \({\text{AC}} = – 0.5\), award (M1) for \(2(8) + 3 – 19 = 0\) and (A1) for (therefore) \(2y + x – 19 = 0\).
Simply substituting \((3,{\text{ }}8)\) into the equation of \({L_2}\) with no other prior working, earns no marks.[5 marks]
\((6,{\text{ }}6.5)\) (A1)(A1)(G2)
Note: Award (A1) for 6, (A1) for 6.5. Award a maximum of (A1)(A0) if answers are not given as a coordinate pair. Accept \(x = 6,{\text{ }}y = 6.5\).
Award (M1)(A0) for an attempt to solve the two simultaneous equations \(2y – x – 7 = 0\) and \(2y + x – 19 = 0\) algebraically, leading to at least one incorrect or missing coordinate.[2 marks]
3.3541 (A1)
Note: Answer must be to 5 significant figures.[1 mark]
\(2 \times \frac{1}{2} \times \sqrt {80} \times \frac{{\sqrt {45} }}{2}\) (M1)(M1)
Notes: Award (M1) for correct substitution into area of triangle formula.
If their triangle is a quarter of the rhombus then award (M1) for multiplying their triangle by 4.
If their triangle is a half of the rhombus then award (M1) for multiplying their triangle by 2.
OR
\(\frac{1}{2} \times \sqrt {80} \times \sqrt {45} \) (M1)(M1)
Notes: Award (M1) for doubling MD to get the diagonal BD, (M1) for correct substitution into the area of a rhombus formula.
Award (M1)(M1) for \(\sqrt {80} \times \) their (f).
\( = 30\) (A1)(ft)(G3)
Notes: Follow through from parts (c) and (f).
\(8.94 \times 3.3541 = 29.9856 \ldots \)[3 marks]
Question
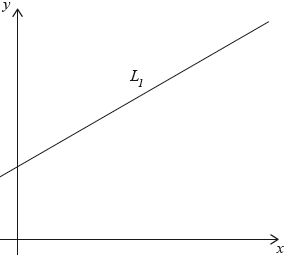
Abdallah owns a plot of land, near the river Nile, in the form of a quadrilateral ABCD.
The lengths of the sides are \({\text{AB}} = {\text{40 m, BC}} = {\text{115 m, CD}} = {\text{60 m, AD}} = {\text{84 m}}\) and angle \({\rm{B\hat AD}} = 90^\circ \).
This information is shown on the diagram.
The formula that the ancient Egyptians used to estimate the area of a quadrilateral ABCD is
\({\text{area}} = \frac{{({\text{AB}} + {\text{CD}})({\text{AD}} + {\text{BC}})}}{4}\).
Abdallah uses this formula to estimate the area of his plot of land.
Show that \({\text{BD}} = 93{\text{ m}}\) correct to the nearest metre.[2]
Calculate angle \({\rm{B\hat CD}}\).[3]
Find the area of ABCD.[4]
Calculate Abdallah’s estimate for the area.[2]
Find the percentage error in Abdallah’s estimate.[2]
Answer/Explanation
Markscheme
\({\text{B}}{{\text{D}}^2} = {40^2} + {84^2}\) (M1)
Note: Award (M1) for correct substitution into Pythagoras.
Accept correct substitution into cosine rule.
\({\text{BD}} = 93.0376 \ldots \) (A1)
\( = 93\) (AG)
Note: Both the rounded and unrounded value must be seen for the (A1) to be awarded.[2 marks]
\(\cos C = \frac{{{{115}^2} + {{60}^2} – {{93}^2}}}{{2 \times 115 \times 60}}{\text{ }}({93^2} = {115^2} + {60^2} – 2 \times 115 \times 60 \times \cos C)\) (M1)(A1)
Note: Award (M1) for substitution into cosine formula, (A1) for correct substitutions.
\( = 53.7^\circ {\text{ }}(53.6679 \ldots ^\circ )\) (A1)(G2)[3 marks]
\(\frac{1}{2}(40)(84) + \frac{1}{2}(115)(60)\sin (53.6679 \ldots )\) (M1)(M1)(A1)(ft)
Note: Award (M1) for correct substitution into right-angle triangle area. Award (M1) for substitution into area of triangle formula and (A1)(ft) for correct substitution.
\( = 4460{\text{ }}{{\text{m}}^2}{\text{ }}(4459.30 \ldots {\text{ }}{{\text{m}}^2})\) (A1)(ft)(G3)
Notes: Follow through from part (b).[4 marks]
\(\frac{{(40 + 60)(84 + 115)}}{4}\) (M1)
Note: Award (M1) for correct substitution in the area formula used by ‘Ancient Egyptians’.
\( = 4980{\text{ }}{{\text{m}}^2}{\text{ }}(4975{\text{ }}{{\text{m}}^2})\) (A1)(G2)[2 marks]
\(\left| {\frac{{4975 – 4459.30 \ldots }}{{4459.30 \ldots }}} \right| \times 100\) (M1)
Notes: Award (M1) for correct substitution into percentage error formula.
\( = 11.6{\text{ }}(\% ){\text{ }}(11.5645 \ldots )\) (A1)(ft)(G2)
Notes: Follow through from parts (c) and (d)(i).[2 marks]
Question
The Tower of Pisa is well known worldwide for how it leans.
Giovanni visits the Tower and wants to investigate how much it is leaning. He draws a diagram showing a non-right triangle, ABC.
On Giovanni’s diagram the length of AB is 56 m, the length of BC is 37 m, and angle ACB is 60°. AX is the perpendicular height from A to BC.
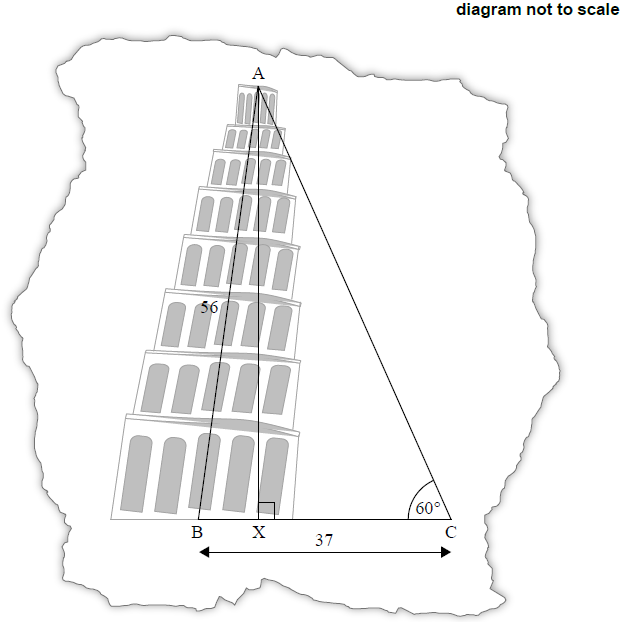
Giovanni’s tourist guidebook says that the actual horizontal displacement of the Tower, BX, is 3.9 metres.
Use Giovanni’s diagram to show that angle ABC, the angle at which the Tower is leaning relative to the
horizontal, is 85° to the nearest degree.[5]
Use Giovanni’s diagram to calculate the length of AX.[2]
Use Giovanni’s diagram to find the length of BX, the horizontal displacement of the Tower.[2]
Find the percentage error on Giovanni’s diagram.[2]
Giovanni adds a point D to his diagram, such that BD = 45 m, and another triangle is formed.
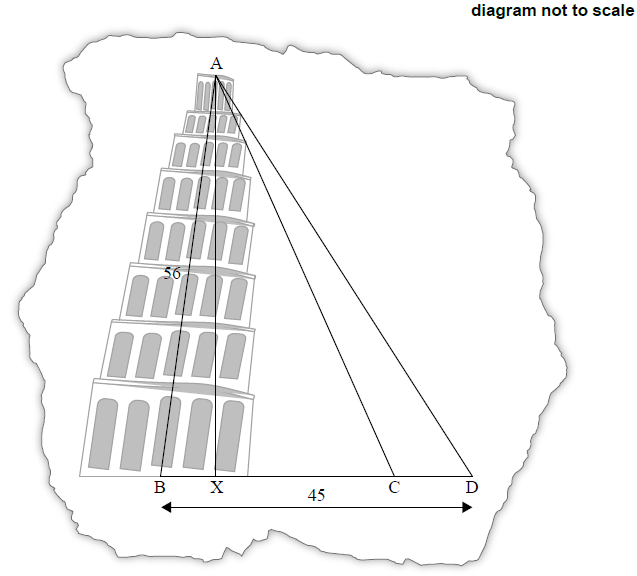
Find the angle of elevation of A from D.[3]
Answer/Explanation
Answer/Explanation
Markscheme
\(\frac{{{\text{sin BAC}}}}{{37}} = \frac{{{\text{sin 60}}}}{{56}}\) (M1)(A1)
Note: Award (M1) for substituting the sine rule formula, (A1) for correct substitution.
angle \({\text{B}}\mathop {\text{A}}\limits^ \wedge {\text{C}}\) = 34.9034…° (A1)
Note: Award (A0) if unrounded answer does not round to 35. Award (G2) if 34.9034… seen without working.
angle \({\text{A}}\mathop {\text{B}}\limits^ \wedge {\text{C}}\) = 180 − (34.9034… + 60) (M1)
Note: Award (M1) for subtracting their angle BAC + 60 from 180.
85.0965…° (A1)
85° (AG)
Note: Both the unrounded and rounded value must be seen for the final (A1) to be awarded. If the candidate rounds 34.9034…° to 35° while substituting to find angle \({\text{A}}\mathop {\text{B}}\limits^ \wedge {\text{C}}\), the final (A1) can be awarded but only if both 34.9034…° and 35° are seen.
If 85 is used as part of the workings, award at most (M1)(A0)(A0)(M0)(A0)(AG). This is the reverse process and not accepted.
sin 85… × 56 (M1)
= 55.8 (55.7869…) (m) (A1)(G2)
Note: Award (M1) for correct substitution in trigonometric ratio.
\(\sqrt {{{56}^2} – 55.7869{ \ldots ^2}} \) (M1)
Note: Award (M1) for correct substitution in the Pythagoras theorem formula. Follow through from part (a)(ii).
OR
cos(85) × 56 (M1)
Note: Award (M1) for correct substitution in trigonometric ratio.
= 4.88 (4.88072…) (m) (A1)(ft)(G2)
Note: Accept 4.73 (4.72863…) (m) from using their 3 s.f answer. Accept equivalent methods.[2 marks]
\(\left| {\frac{{4.88 – 3.9}}{{3.9}}} \right| \times 100\) (M1)
Note: Award (M1) for correct substitution into the percentage error formula.
= 25.1 (25.1282) (%) (A1)(ft)(G2)
Note: Follow through from part (a)(iii).[2 marks]
\({\text{ta}}{{\text{n}}^{ – 1}}\left( {\frac{{55.7869 \ldots }}{{40.11927 \ldots }}} \right)\) (A1)(ft)(M1)
Note: Award (A1)(ft) for their 40.11927… seen. Award (M1) for correct substitution into trigonometric ratio.
OR
(37 − 4.88072…)2 + 55.7869…2
(AC =) 64.3725…
64.3726…2 + 82 − 2 × 8 × 64.3726… × cos120
(AD =) 68.7226…
\(\frac{{{\text{sin 120}}}}{{68.7226 \ldots }} = \frac{{{\text{sin A}}\mathop {\text{D}}\limits^ \wedge {\text{C}}}}{{64.3725 \ldots }}\) (A1)(ft)(M1)
Note: Award (A1)(ft) for their correct values seen, (M1) for correct substitution into the sine formula.
= 54.3° (54.2781…°) (A1)(ft)(G2)
Note: Follow through from part (a). Accept equivalent methods.[3 marks]
Question
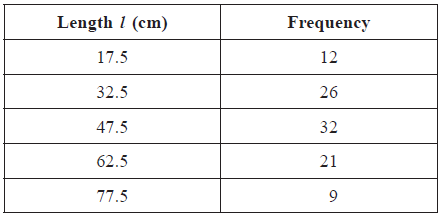
The lengths (\(l\)) in centimetres of \(100\) copper pipes at a local building supplier were measured. The results are listed in the table below.
Write down the mode.[1]
Using your graphic display calculator, write down the value of
(i) the mean;
(ii) the standard deviation;
(iii) the median.[4]
Find the interquartile range.[2]
Draw a box and whisker diagram for this data, on graph paper, using a scale of \(1{\text{ cm}}\) to represent \(5{\text{ cm}}\).[4]
Sam estimated the value of the mean of the measured lengths to be \(43{\text{ cm}}\).
Find the percentage error of Sam’s estimated mean.[2]
Answer/Explanation
Markscheme
\(47.5{\text{ (cm)}}\) (A1)
(i) \(45.85{\text{ (cm)}}\) (G2)
Note: Accept \(45.9\) .
(ii) \(17.1{\text{ }}(17.0888 \ldots )\) (G1)
(iii) \(47.5{\text{ (cm)}}\) (G1)
\(62.5 – 32.5 = 30\) (M1)(A1)(G2)
Note: Award (M1) for correct quartiles seen.
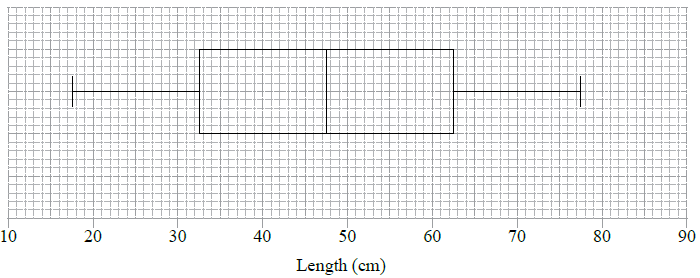
(A1) for correct label and scale
(A1)(ft) for correct median
(A1)(ft) for correct quartiles and box
(A1) for endpoints at \(17.5\) and \(77.5\) joined to box by straight lines (A1)(A1)(ft)(A1)(ft)(A1)
Notes: The final (A1) is lost if the lines go through the box. Follow through from their parts (b) and (c).
\(\varepsilon = \left| {\frac{{43 – 45.85}}{{45.85}}} \right| \times 100\% \) (M1)
Note: Award (M1) for their correct substitution in \(\% \) error formula.
\( = 6.22\% \) (\(6.21592 \ldots \)) (A1)(ft)(G2)
Notes: Follow through from their answer to part (b)(i). Accept \(6.32\% \) with use of \(45.9\) .