Question
A random sample of 200 females measured the length of their hair in cm. The results are displayed in the cumulative frequency curve below.

Write down the median length of hair in the sample.[1]
Find the interquartile range for the length of hair in the sample.[2]
Given that the shortest length was \(6{\text{ cm}}\) and the longest \(47{\text{ cm}}\), draw and label a box and whisker plot for the data on the grid provided below.
 [3]
[3]
Answer/Explanation
Markscheme
Unit penalty (UP) is applicable where indicated in the left hand column.
(UP) \(26{\text{cm}}\) (A1) (C1)[1 mark]
Unit penalty (UP) is applicable where indicated in the left hand column.
\(33 – 19\) for identifying correct quartiles. (A1)
(UP) \( = 14{\text{ cm}}\) . (A1)(ft) (C2)
Note: (ft) on their quartiles.[2 marks]

correct median (A1)(ft)
correct quartiles and box (A1)(ft)
endpoints at \(6\) and \(47\), joined to box by straight lines. (A1) (C3)[3 marks]
Question
The diagram below shows the cumulative frequency distribution of the heights in metres of \(600\) trees in a wood.

Write down the median height of the trees.[1]
Calculate the interquartile range of the heights of the trees.[2]
Given that the smallest tree in the wood is \(3{\text{ m}}\) high and the tallest tree is \(28{\text{ m}}\) high, draw the box and whisker plot on the grid below that shows the distribution of trees in the wood.
 [3]
[3]
Answer/Explanation
Markscheme
Median \( = 11{\text{ m}}\) (A1) (C1)
Note: Award A0 for “\(11\)” without units; correct units must be included for the A1 to be awarded.[1 mark]
\({\text{Interquartile range}} = 14 – 10\) (A1)
\( = 4\) (A1)(ft) (C2)
Note: (M1) for taking a sensible difference or for both correct quartile values seen.[2 marks]

correct median (A1)(ft)
correct quartiles and box (A1)(ft)
endpoints at \(3\) and \(28\), joined to box by straight lines (A1) (C3)
Notes: Award (A0) if the lines go right through the box. Award final (A1) if the whisker goes to \(20\) with an outlier at \(28\).[3 marks]
Question
A cumulative frequency graph is given below which shows the height of students in a school.

Write down the median height of the students.[1]
Write down the 25th percentile.[1]
Write down the 75th percentile.[1]
The height of the tallest student is 195 cm and the height of the shortest student is 136 cm.
Draw a box and whisker plot on the grid below to represent the heights of the students in the school.
 [3]
[3]
Answer/Explanation
Markscheme
170 (A1) (C1)[1 mark]
163 (A1) (C1)[1 mark]
172 (A1) (C1)[1 mark]
 (A1)(ft)(A1)(ft)(A1) (C3)
Notes: Award (A1)(ft) for correct median, (A1)(ft) for correct quartiles and box (A1) for correct end points of whiskers.
Award at most (A1)(A1)(A0) if lines go right through the box.[3 marks]
Question
120 Mathematics students in a school sat an examination. Their scores (given as a percentage) were summarized on a cumulative frequency diagram. This diagram is given below.

Complete the grouped frequency table for the students.
 [3]
[3]
Write down the mid-interval value of the \(40 < x \leqslant 60\) interval.[1]
Calculate an estimate of the mean examination score of the students.[2]
Answer/Explanation
Markscheme
 (A1)(A1)(A1) (C3)[3 marks]
50 (A1) (C1)[1 mark]
\({\text{Mean}} = \frac{{10 \times 14 + ……. + 90 \times 6}}{{120}}\) (M1)
Note: Award (M1) for correct substitution of their values from (a) in mean formula.
\( = 45\frac{2}{3}(45.7)\) (A1)(ft) (C2)[2 marks]
Question
The cumulative frequency graph shows the amount of time in minutes, 200 students spend waiting for their train on a particular morning.

Write down the median waiting time.[1]
Find the interquartile range for the waiting time.[2]
Draw a box and whisker plot on the grid below to represent this information.
 [3]
[3]
Answer/Explanation
Markscheme
Median = 25 mins (A1) (C1)[1 mark]
32 – 16 (A1)
= 16 (A1)(ft) (C2)
Notes: Award (A1) for identifying correct quartiles, (A1)(ft) for correct answer to subtraction of their quartiles.[2 marks]

median shown (A1)(ft)
box with ends at their quartiles (A1)(ft)
end points at 0 and 45 joined to box with straight lines (A1) (C3)
Note: Award (A1)(ft)(A1)(ft)(A0) if lines go right through the box.[3 marks]
Question
The cumulative frequency curve shows the percentage marks, given correct to the nearest integer, gained by 500 students in an examination.

The passing grades were determined as given below.
85 to 100 %, grade A
66 to 84 %, grade B
57 to 65 %, grade C
50 to 56 %, grade D
Those scoring less than 50 % failed the examination.
Find the number of students who failed the examination.[2]
Find the number of students who were awarded grade C or better.[2]
The top 20 % of the students are eligible for further study.
Find the lowest mark required to be eligible for further study.[2]
Answer/Explanation
Markscheme
200 (students) (M1)(A1) (C2)
Note: Award (M1) for line drawn on the graph connecting 50 % with 200 or any indication (cross or dash) at the required point on the graph, (A1) for correct answer.[2 marks]
500 – 350 (M1)
Notes: Award (M1) for 350 seen or for a line on the graph from 57 % up to the curve showing number of students. An indication (cross or dash) at the required point on the graph is sufficient for method.
= 150 (A1) (C2)[2 marks]
60 (%) (M1)(A1) (C2)
Notes: Award (M1) for 400 or a line on the graph at 400 seen, (A1) for correct answer. % sign not required. An indication (cross or dash) at the required point on the graph is sufficient for method.[2 marks]
Question
Toronto’s annual snowfall, x, in cm, has been recorded for the past 176 years. The results are shown in the table.

Write down the modal class.[1]
Write down the mid interval value for the class 6 ≤ x < 10 .[1]
Calculate an estimate of the mean annual snowfall.[2]
Find the number of years for which the annual snowfall was at least 18 cm.[2]
Answer/Explanation
Markscheme
14 ≤ x < 18 (A1) (C1)[1 mark]
8 (A1) (C1)[1 mark]
\(\frac{{{\text{4}} \times {\text{30 + 8}} \times {\text{26 + 12}} \times {\text{29 + 16}} \times {\text{32 + 20}} \times {\text{18 + 24}} \times {\text{27 + 28}} \times {\text{14}}}}{{176}}\) (M1)
Notes: Award (M1) for an attempt to substitute their mid-interval values (consistent with their answer to part (b)) into the formula for the mean. Award (M1) where a table is constructed with their (consistent) mid-interval values listed along with the frequencies.
= 14.7 (cm) (14.7045…) (A1)(ft) (C2)
Notes: Follow through from their answer to part (b). If a final incorrect answer that is consistent with their (b) is given award (M1)(A1)(ft) even if no working is seen.[2 marks]
18 + 27 + 14 (M1)
Note: Award (M1) for adding 18, 27 and 14.
= 59 (A1) (C2)[2 marks]
Question
The cumulative frequency graph shows the heights, in cm, of 80 young trees.

Write down the median height of the trees.[1]
Write down the 75th percentile.[1]
Find the interquartile range.[2]
Estimate the number of trees that are more than 40 cm in height.[2]
Answer/Explanation
Markscheme
54 (cm) (A1) (C1)
58 (A1) (C1)
58, 45 (A1)
Note: Award (A1) for 45 seen.
58 − 45
= 13 (A1)(ft) (C2)
Note: Follow through from part (b).
80 − 14 (M1)
Note: Award (M1) for 14 seen.
= 66 (A1) (C2)
Question
The table shows the number of bicycles owned by 50 households.

Write down the value of
(i) t ;
(ii) w .[2]
Indicate with a tick ( ) whether the following statements are True or False.
 [4]
[4]
Answer/Explanation
Markscheme
(i) 8 (A1)
(ii) 48 (A1)(ft) (C2)
Note: Follow through from their t, even if no workings seen as long as w < 50.
 (A1)(A1)(A1)(A1) (C4)
Question
\(240\) cars were tested to see how far they travelled on \(10\) litres of fuel. The graph shows the cumulative frequency distribution of the results.
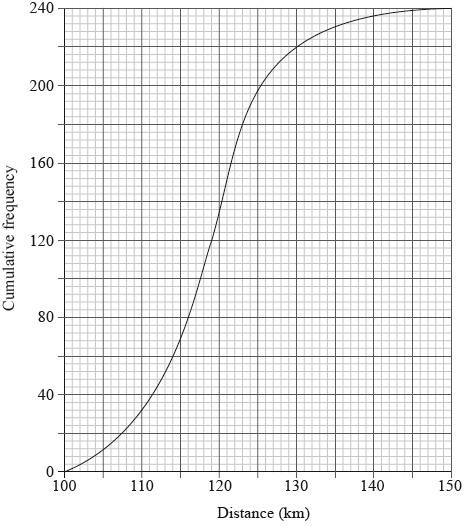
Find the median distance travelled by the cars.[2]
Calculate the interquartile range of the distance travelled by the cars.[2]
Find the number of cars that travelled more than \(130\) km.[2]
Answer/Explanation
Markscheme
\({{\text{Q}}_2} = 119{\text{ km}}\) (M1)(A1) (C2)
Note: Award (M1) for indication on graph of correct position of median.[2 marks]
\({{\text{Q}}_1} = 114{\text{ and }}{{\text{Q}}_3} = 123\) (A1)
Note: Award (A1) for correct quartiles seen.
\(9\) (A1) (C2)[2 marks]
\(240 – 220\) (M1)
Note: Award (M1) for \(220\) seen.
\( = 20\) (A1) (C2)[2 marks]
Question
The cumulative frequency graph represents the speed, s, in \({\text{km }}{{\text{h}}^{ – 1}}\), of 80 cars passing a speed camera.
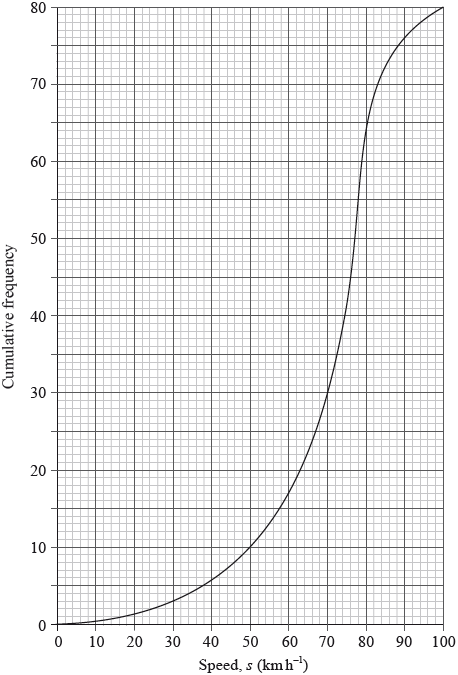
Write down the number of cars passing the camera with speed of less than or equal to 50 \({\text{km}}\,{{\text{h}}^{ – 1}}\).[1]
Complete the following grouped frequency table for \(s\), the speed of the cars passing the camera.
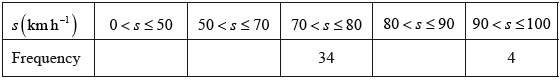 [1]
[1]
Write down the mid-interval value of the \(50 < s \leqslant 70\) interval.[1]
Use your graphic display calculator to find an estimate of
(i) the mean speed of the cars passing the camera;
(ii) the standard deviation of the speed of the cars passing the camera.[3]
Answer/Explanation
Markscheme
10 (A1) (C1)[1 mark]
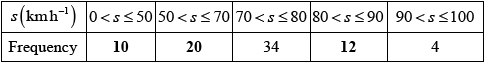 (A1)(ft) (C1)
Note: Follow through from their answer to part (a).[1 mark]
60 (A1) (C1)[1 mark]
(i) \(67.5 \left( {{\text{km}}\,{{\text{h}}^{ – 1}}} \right)\) (A2)(ft)
Notes: Award (M1) for an attempt to use the formula for the mean with at least two midpoint values consistent with their answer to part (c). Follow through from their table in part (b).
(ii) \(18.6 (18.6413…)\) (A1)(ft) (C3)
Note: Follow through from their table in part (b).[3 marks]
Question
The time, in minutes, that students in a school spend on their homework per day is presented in the following box-and-whisker diagram.
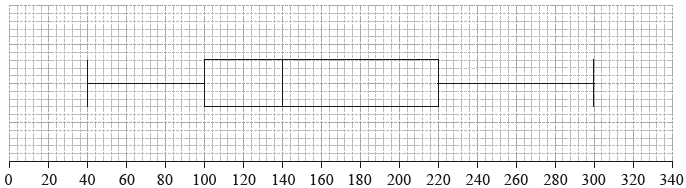
Time, in minutes, students spend on their homework per day
Find
(i) the longest amount of time spent on homework per day;
(ii) the interquartile range.[3]
State the statistical term corresponding to the value of 140 minutes.[1]
Find the percentage of students who spend
(i) between 100 and 140 minutes per day on their homework;
(ii) more than 100 minutes per day on their homework.[2]
Answer/Explanation
Markscheme
(i) 300 (minutes) OR 5 hours (A1)
Note: If answer given in hours, the unit must be seen.
(ii) 220 – 100 (M1)
Notes: Award (M1) for the two quartiles seen.
= 120 (minutes) OR 2 hours (A1) (C3)
Note: If answer given in hours, the unit must be seen.
median (time spent on homework per day) (A1) (C1)
Note: Do not accept middle or medium etc.
(i) 25 (A1)
(ii) 75 (A1) (C2)
Question
A group of 20 students travelled to a gymnastics tournament together. Their ages, in years, are given in the following table.
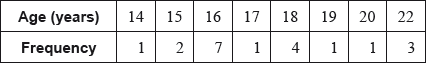
The lower quartile of the ages is 16 and the upper quartile is 18.5.
For the students in this group find the mean age;[2]
For the students in this group write down the median age.[1]
Draw a box-and-whisker diagram, for these students’ ages, on the following grid.
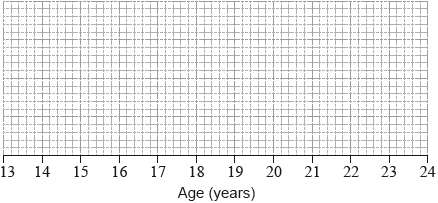 [3]
[3]
Answer/Explanation
Markscheme
\(\frac{{14 + 2 \times 15 + 7 \times 16 + 17 + 4 \times 18 + 19 + 20 + 3 \times 22}}{{20}}\) (M1)
Note: Award (M1) for correct substitutions into mean formula.
\(( = ){\text{ }}17.5\) (A1) (C2)[2 marks]
16.5 (A1) (C1)[1 mark]
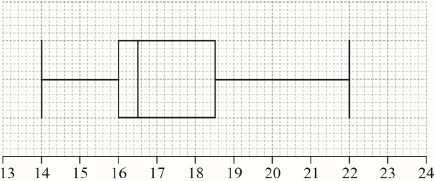 (A1)(A1)(A1)(ft) (C3)
Note: Award (A1) for correct endpoints, (A1) for correct quartiles, (A1)(ft) for their median. Follow through from part (a)(ii), but only if median is between 16 and 18.5. If a horizontal line goes through the box, award at most (A1)(A1)(A0). Award at most (A0)(A1)(A1) if a ruler has not been used.[3 marks]